MEMBERS ONLY

Flip the Script: Defense as Your New Offensive Playbook

by Karl Montevirgen,
The StockCharts Insider
KEY TAKEAWAYS
* March is a strong seasonal month for Utilities and Consumer Staples in relation to the broader market
* Utilities and Consumer Staples are defensive plays which, if timed correctly, can result in a positive market outcome
* The StockCharts Seasonality charts can help you identify sector plays that may not...
READ MORE
MEMBERS ONLY

DP Trading Room: The PMO Versus the MACD!

by Erin Swenlin,
Vice President, DecisionPoint.com
Today Carl explains the benefits of using the Price Momentum Oscillator versus the MACD. They are not the same!
Carl then gives us his insights on the market in general as well as Bitcoin news, Magnificent 7 overview, as well as Crude Oil and Interest Rates.
Erin gives us an...
READ MORE
MEMBERS ONLY
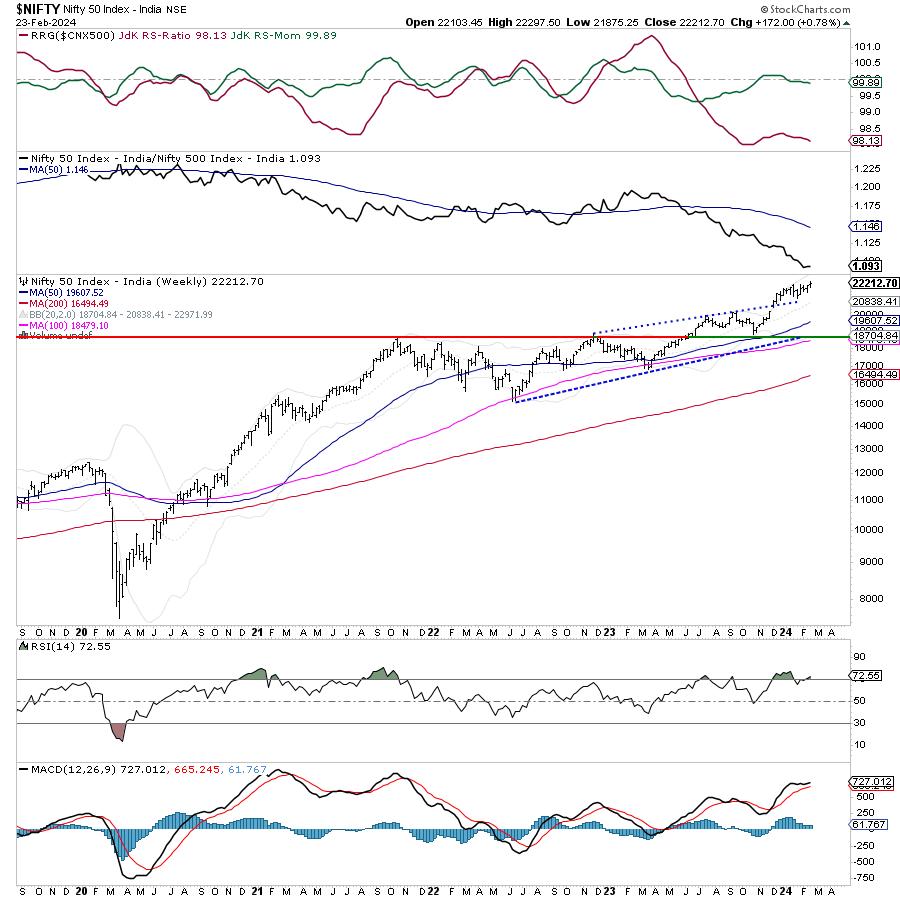
Week Ahead: NIFTY Likely to Continue Consolidating; Finding Relative Outperformance

by Milan Vaishnav,
Founder and Technical Analyst, EquityResearch.asia and ChartWizard.ae
In the previous technical note, it was categorically mentioned that, while the overall trend may stay intact, the markets could continue to largely consolidate. In line with the analysis, the markets kept consolidating, staying in a broad but defined trading range. That range, over the past week, was 422 points;...
READ MORE
MEMBERS ONLY
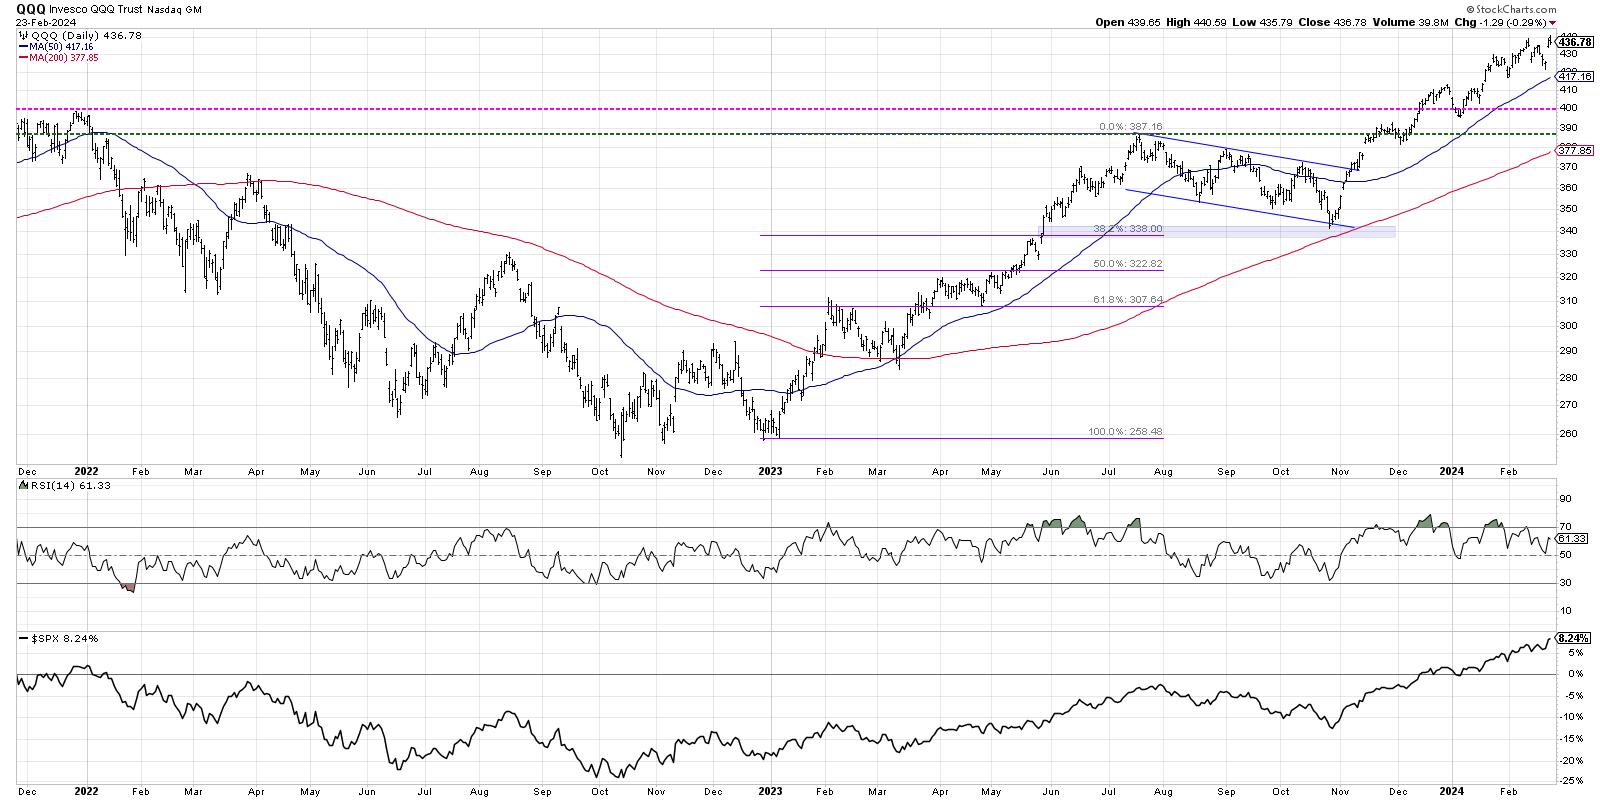
How Overextended Are You, QQQ?

by David Keller,
President and Chief Strategist, Sierra Alpha Research
We've highlighted all the warning signs as this bull market phase has seemed to near an exhaustion point. We shared bearish market tells, including the dreaded Hindenburg Omen,and how leading growth stocks have beendemonstrating questionable patterns. But despite all of those signs of market exhaustion, our growth-led...
READ MORE
MEMBERS ONLY

MEM TV: Simple Way to Identify a Buy Point in NVDA

by Mary Ellen McGonagle,
President, MEM Investment Research
In this episode of StockCharts TV'sThe MEM Edge, Mary Ellen reviews what drove the markets to new highs and what areas are outperforming. She also shares how to identify a buy point in NVDA after its gap up following earnings, as well as how to determine when a...
READ MORE
MEMBERS ONLY

Is Energy About to Undergo a Strong Seasonal Sector Surge?
by Karl Montevirgen,
The StockCharts Insider
KEY TAKEAWAYS
* Combining fundamental forecasts with seasonality patterns offers a potent strategy for identifying tradable opportunities in specific sectors
* The Energy (XLE), Utilities (XLU), and Materials (XLB) sectors exhibit the strongest seasonal performance in the near-term
* Seasonality charts provide valuable insights, but checking overall stock market conditions and technical trading...
READ MORE
MEMBERS ONLY

The Halftime Show: Don't Box the Invisible Man -- EPS Reports

by Pete Carmasino,
Chief Market Strategist, Chaikin Analytics
On this week's edition ofStockCharts TV'sHalftime, Pete takes a look at long-term trends. Semiconductors taking it on the chin. Inflation is still a problem. Bonds are selling off, and the Fed isn't cutting rates until, in Pete's opinion, the unemployment rate falls....
READ MORE
MEMBERS ONLY

Sector Spotlight: Dominant Trend for Stocks Still UP

by Julius de Kempenaer,
Senior Technical Analyst, StockCharts.com
On this episode of StockCharts TV's Sector Spotlight, I separate the 11 sectors in the S&P 500 into Offensive, Defensive, and Sensitive, assessing their group rotational patterns to see if there is any alignment with the current technical condition of the S&P 500. After...
READ MORE
MEMBERS ONLY
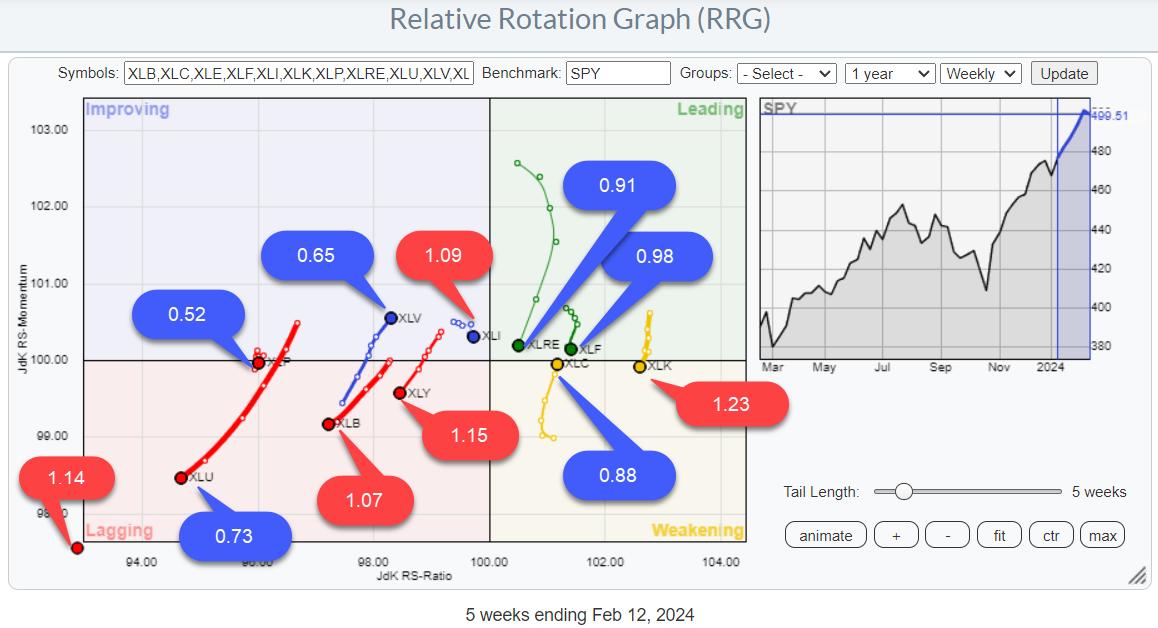
SPY Uptrend Intact, But Mixed Sector Rotation Signals Hesitation
by Julius de Kempenaer,
Senior Technical Analyst, StockCharts.com
KEY TAKEAWAYS
* Looking at Risk ON / OFF through BETA
* RRG shows mixed rotations
* SPY Uptrend intact with limited downside risk
BETA
One of the Risk ON/OFF metrics I like to keep an eye on is BETA.
From Investopedia:
—systematic risk—
I have updated my spreadsheet with last year'...
READ MORE
MEMBERS ONLY
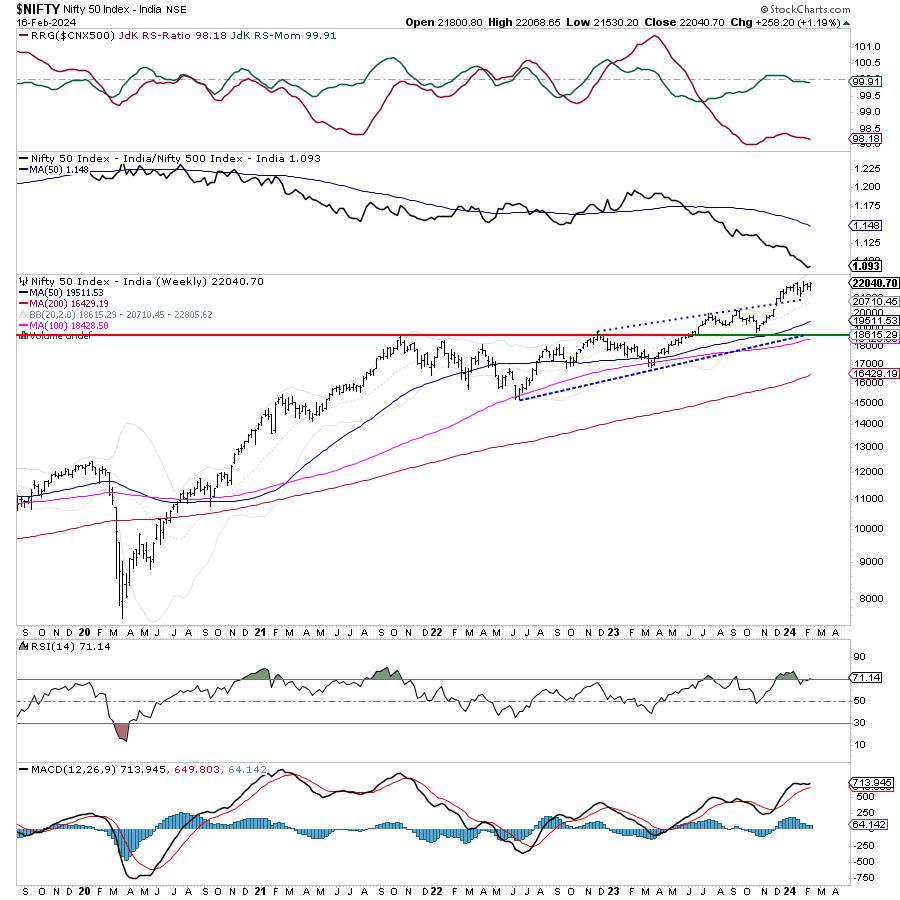
Week Ahead: NIFTY Stays In A Defined Range; Expect Directional Moves Only Outside These Levels
by Milan Vaishnav,
Founder and Technical Analyst, EquityResearch.asia and ChartWizard.ae
Some serious consolidation continued in the markets as the Nifty oscillated in a defined range before closing the week with modest gains. Examination of daily charts shows that the Nifty tested its 50-DMA again and rebounded from that level while defending that point as important support. The trading range widened...
READ MORE
MEMBERS ONLY
MEM TV: Risk-On Trades Emerge Amid Big Tech Selloff
by Mary Ellen McGonagle,
President, MEM Investment Research
In this episode of StockCharts TV'sThe MEM Edge, Mary Ellen reviews the sloppy week for the markets, driven by the key economic data that was released. We saw interest rates rise, which had some other carry-on impact. While the S&P 500 saw a bit of a...
READ MORE
MEMBERS ONLY
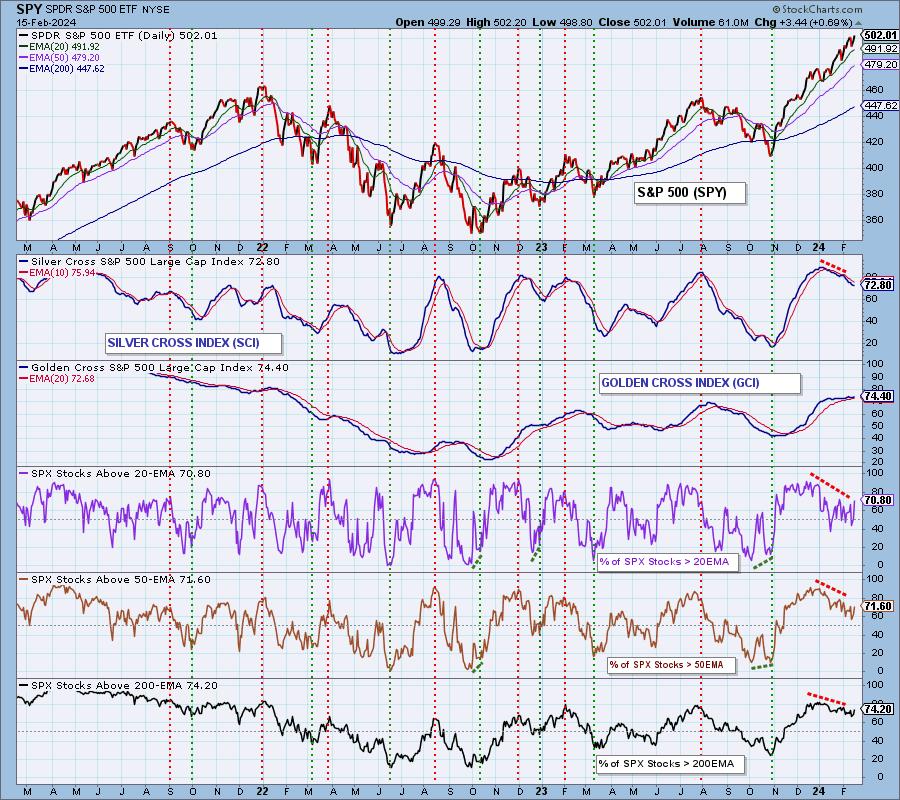
BUY Signals Continue to Diminish

by Carl Swenlin,
President and Founder, DecisionPoint.com
A Golden Cross BUY Signal is generated when the 50-day EMA of a price index crosses up through its 200-day EMA. DecisionPoint's Golden Cross Index (GCI) shows the percentage of stocks in a price index that have a Golden Cross BUY Signal, and is an expression of long-term...
READ MORE
MEMBERS ONLY

Sector Spotlight: EASY SCAN! Find Growth Names in Small-Caps
by Julius de Kempenaer,
Senior Technical Analyst, StockCharts.com
On this episode of StockCharts TV's Sector Spotlight, I start with an assessment of the daily and weekly charts for SPY, trying to put recent developments into perspective. Then, I go over various Relative Rotation Graphs slicing the market down into various-size segments, as well as growth and...
READ MORE
MEMBERS ONLY

DP Trading Room: Avoid These "Magnificent 7" Stocks!
by Erin Swenlin,
Vice President, DecisionPoint.com
On today's DecisionPoint Trading Room episode, Carl reviews the Magnificent 7 and gives you his opinion on their current and possible future states. He warns against two in particular and gives his stamp of approval on three others. Negative divergences are still a problem and Carl explains why....
READ MORE
MEMBERS ONLY

MEM TV: Best Way To Participate in Stronger Areas of The Market
by Mary Ellen McGonagle,
President, MEM Investment Research
In this episode of StockCharts TV'sThe MEM Edge, Mary Ellen reviews why the markets continue to hit new highs while also highlighting which areas are driving this strength. She then shares a low-risk, simple way to participate in the uptrend among these stronger areas.
This video originally premiered...
READ MORE
MEMBERS ONLY
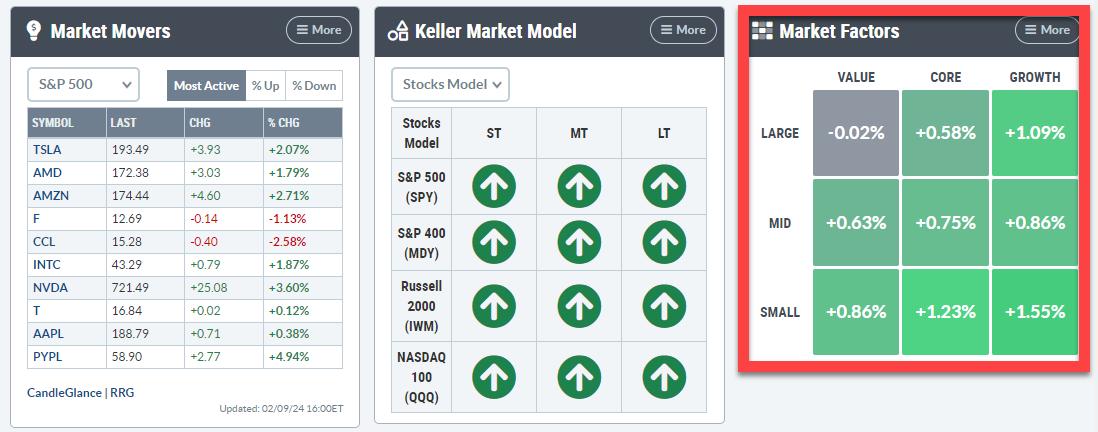
Visualizing the Market Factors Panel on RRG
by Julius de Kempenaer,
Senior Technical Analyst, StockCharts.com
KEY TAKEAWAYS
* Bring the New Market Factors Panel to a Relative Rotation Graph
* Same approach using different index family shows a different image
With the release of the new Panels feature on the StockCharts dashboard, there are a lot of ways that users of RRG charts can take advantage! Let&...
READ MORE
MEMBERS ONLY

Sector Spotlight: Stocks vs. Bonds -- Monthly Trends Revealed!
by Julius de Kempenaer,
Senior Technical Analyst, StockCharts.com
On this episode of StockCharts TV's Sector Spotlight, I review the monthly charts for January 2024, in combination with the Relative Rotation on the Monthly RRGs for asset classes and sectors. At asset class level, the preference for stocks over bonds remains clearly visible. Looking at the monthly...
READ MORE
MEMBERS ONLY

DecisionPoint Trading Room: Narrow Advance a Big Problem!
by Erin Swenlin,
Vice President, DecisionPoint.com
The market rally last week was very narrow, driven mainly by large gains in communication services stocks like Meta. Many technical indicators are showing negative divergences. The broader market struggled. Erin reviews all of the sectors under the hood and then takes your symbol requests.
Key Takeaways:
- Communication services...
READ MORE
MEMBERS ONLY
Strong Earnings Is Driving Sector Rotation Into These 2 Groups
by Mary Ellen McGonagle,
President, MEM Investment Research
It was a choppy push to new highs for the S&P 500 this week, after a sharp drop Wednesday on Fed news was followed by a recovery rally on the heels of strong earnings from select Magnificent 7 names. All three indexes posted a 4th consecutive week of...
READ MORE
MEMBERS ONLY
MEM TV: Here's How to Trade Gaps Up After Earnings!
by Mary Ellen McGonagle,
President, MEM Investment Research
In this episode of StockCharts TV'sThe MEM Edge, Mary Ellen reviews the market's recovery from Fed Chair Powell's comments on Wednesday, sharing exactly what drove the S&P 500 to new highs. She also reviews the sector rotation that's taking place,...
READ MORE
MEMBERS ONLY
This Week's Sector & Industry Group to Watch
by Erin Swenlin,
Vice President, DecisionPoint.com
Before we get started today, I want to encourage you to subscribe to our new YouTube Channel for DecisionPoint. We post the recording of our weekly trading room there, and it is also full of educational videos that Erin has done over the years. Click on this LINK to subscribe...
READ MORE
MEMBERS ONLY
Discretionary vs. Discretionary, a Fierce Battle Under the Hood
by Julius de Kempenaer,
Senior Technical Analyst, StockCharts.com
KEY TAKEAWAYS
* Not all is what it looks like inside the Consumer Discretionary Sector
* Using Cap-weighted vs. Equal-Weighted Sectors on RRG reveals underlying differences
* Mega-cap Stocks are dragging XLY down
* Using a Simple Scan Leads to four interesting charts
Cap-Weighted vs. Equal-Weighted
Sometimes, you need to look a little further....
READ MORE
MEMBERS ONLY

Bullish Buyers Return After Market Selloff
by David Keller,
President and Chief Strategist, Sierra Alpha Research
In this edition of StockCharts TV'sThe Final Bar, Jay Woods, CMT of Freedom Capital Markets brings the energy of the NYSE floor to the show, relating today's market rebound to longer term themes for small caps and regional banks. Dave shares one breadth indicator recognizing broad...
READ MORE
MEMBERS ONLY

DR Horton Stock Plummets: Is Now the Time to Buy the Dip?
by Karl Montevirgen,
The StockCharts Insider
KEY TAKEAWAYS
* DHI's stock plummeted after missing Wall Street's earnings expectations and soft guidance
* Technical indicators provide a clearer view for those looking to buy the dip
* You can use StockCharts seasonality charts to provide a big-picture context to your trading setup
The tight supply environment...
READ MORE
MEMBERS ONLY

Betting Against the Fed is RISKY!
by David Keller,
President and Chief Strategist, Sierra Alpha Research
In this edition of StockCharts TV'sThe Final Bar, Tony Dwyer of Canaccord Genuity shares insights on today's Fed meeting and what data he's following to anticipate rate cuts through 2024. Dave tracks mega cap growth stocks, including MSFT and GOOGL, which are in pullback...
READ MORE
MEMBERS ONLY

Sector Spotlight: The Market is Moving Higher, BUT Avoid Real Estate in February!
by Julius de Kempenaer,
Senior Technical Analyst, StockCharts.com
On this episode of StockCharts TV's Sector Spotlight, after a quick look at asset class rotation and sector rotation for US stocks, I dive into a comparison of cap-weighted sectors vs. equal-weighted sectors and find a big difference for the Consumer Discretionary sector, which underscores and supports the...
READ MORE
MEMBERS ONLY

MEM TV: Market Uptrend Endures Ahead of BIG Earnings Next Week!
by Mary Ellen McGonagle,
President, MEM Investment Research
In this episode of StockCharts TV'sThe MEM Edge, Mary Ellen reviews where the markets stand as we head into earnings from MSFT, GOOGL, AAPL and META. She also discusses how ETFs can help you refine your trading strategies and stock selection, then shares base breakouts and downtrend reversal...
READ MORE
MEMBERS ONLY

Stock Market Indexes Keep Setting New Highs: How Much Higher?

by Jayanthi Gopalakrishnan,
Director of Site Content, StockCharts.com
KEY TAKEAWAYS
* The S&P notched new record highs in five consecutive trading sessions but snapped the winning streak on Friday
* Investors still are complacent, as indicated by the CBOE Volatility index
* The benchmark 10-year Treasury yield remains within a 4% to 4.2% range
In the first week...
READ MORE
MEMBERS ONLY

Sector Spotlight: US Stocks Once Again Lead the World
by Julius de Kempenaer,
Senior Technical Analyst, StockCharts.com
On this episode of StockCharts TV's Sector Spotlight, I highlight the short-term weakness in BTC, the price strength in USD, and the clear strength of stocks over all other asset classes. In sectors, I analyze the continuing rotation out of defensive sectors, which is another positive for stocks...
READ MORE
MEMBERS ONLY

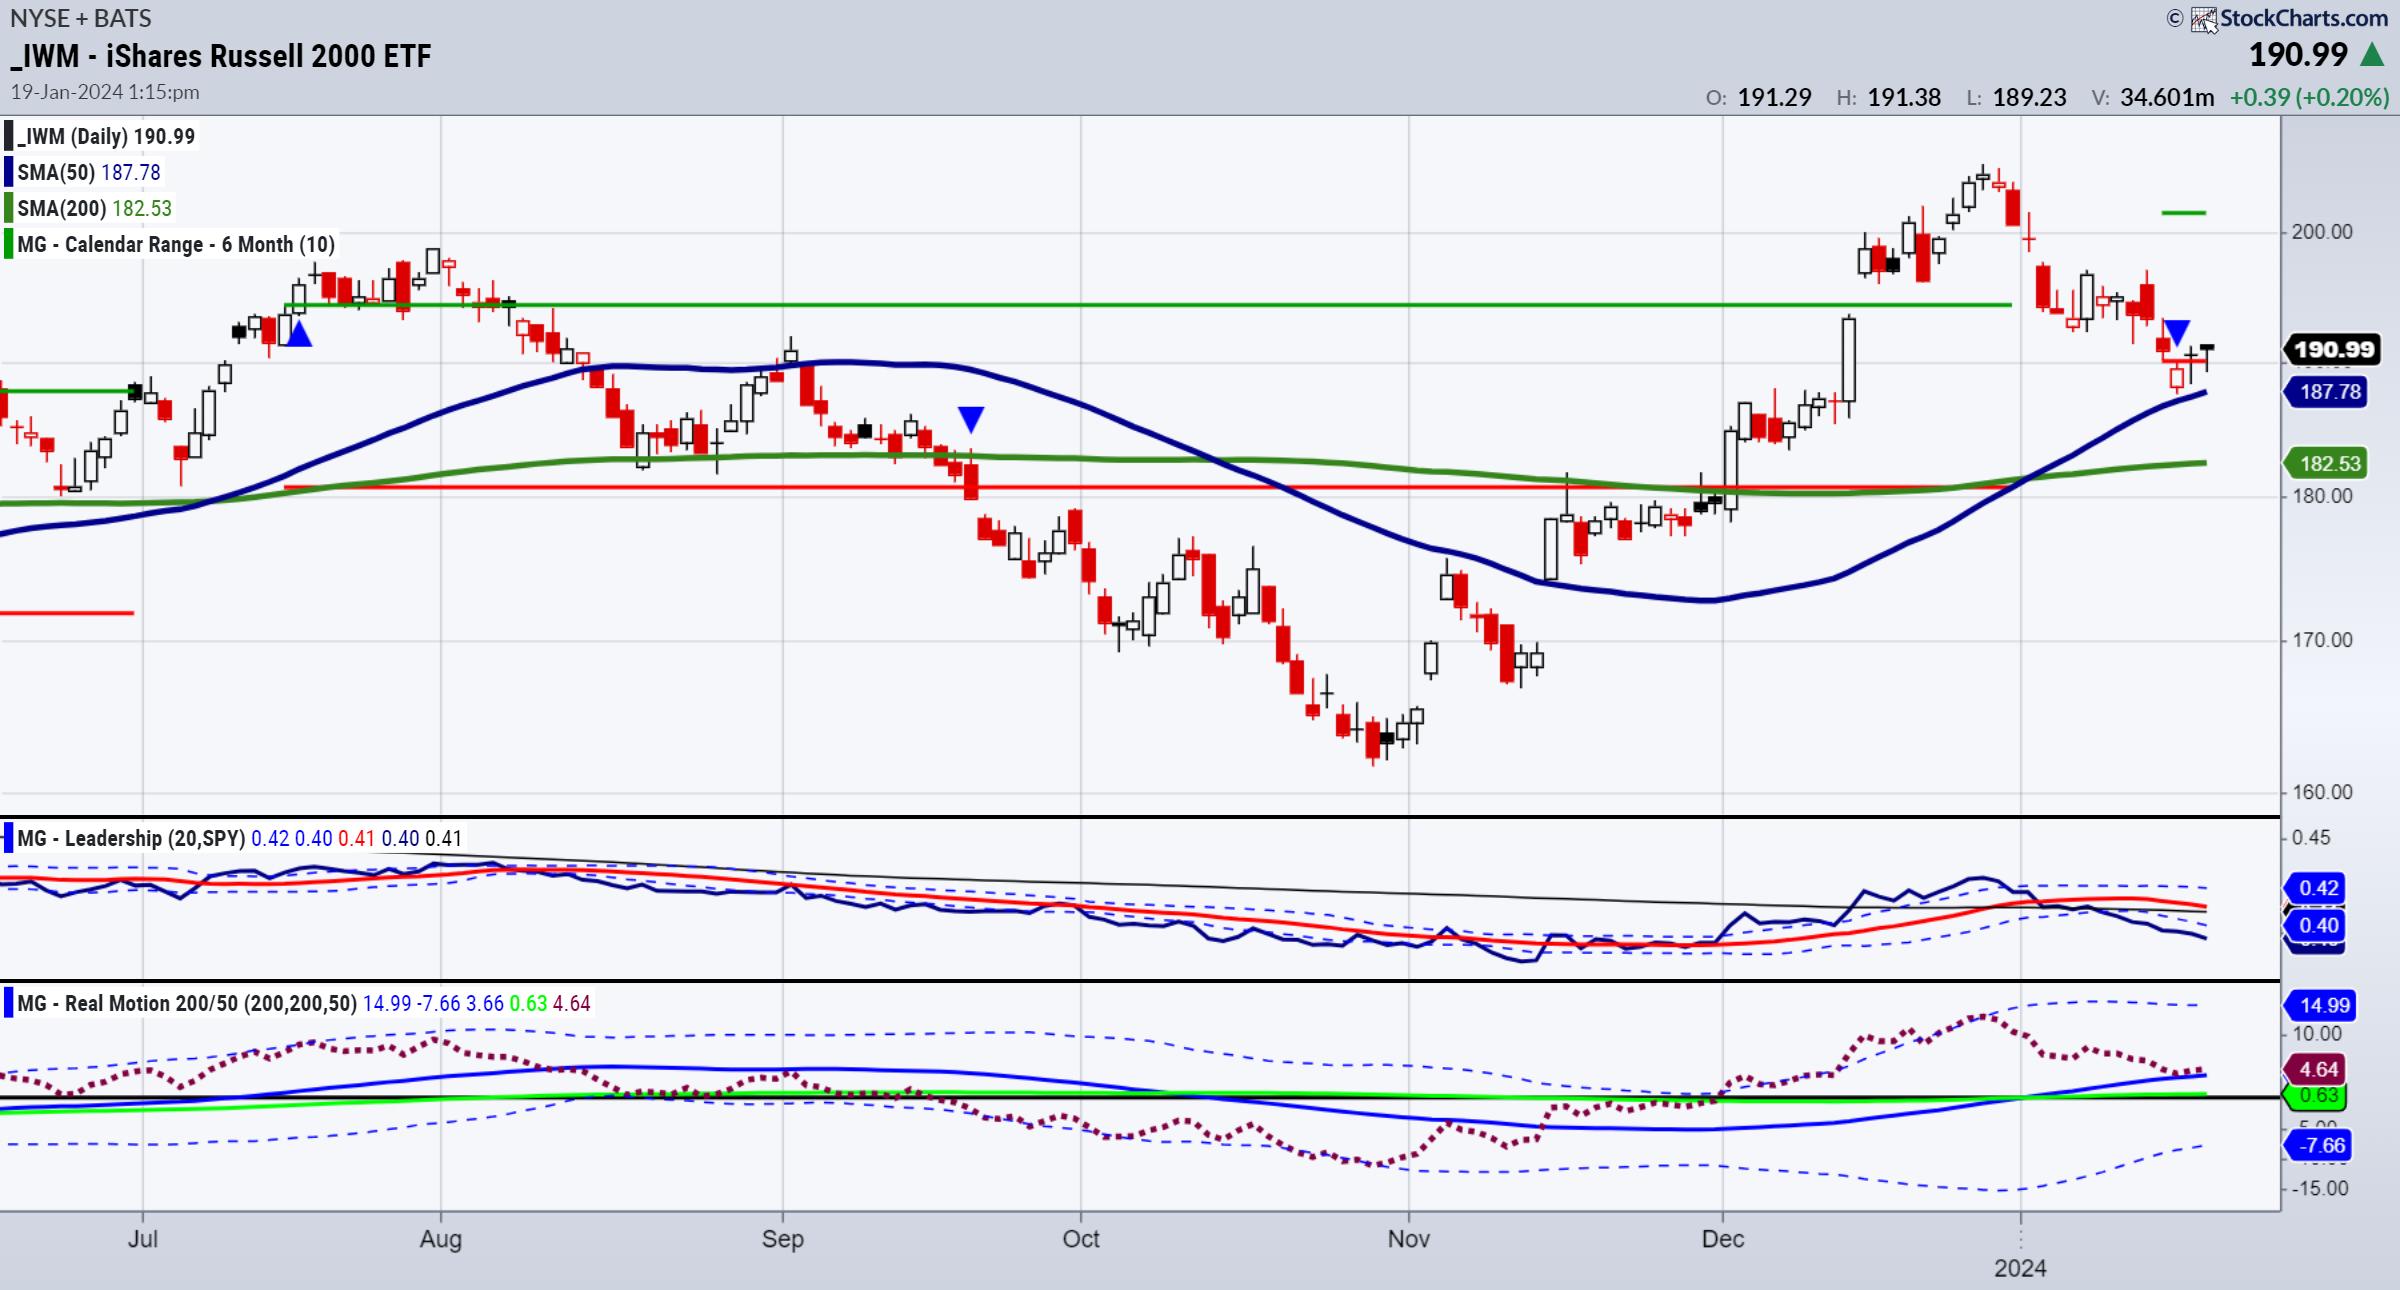
Economic Modern Family Has Divisive Weekly Charts
Over the weekend, I covered the daily charts on the Economic Modern Family, featuring the Russell 2000 (IWM) and Retail (XRT). Both are lagging the benchmark and in the middle of their January trend calendar ranges.
As Semiconductors, NASDAQ, the Dow, and S&P 500 continue to post new...
READ MORE
MEMBERS ONLY

MEM TV: Tech Stocks Blast Higher! S&P 500 Bull Market Confirmed!
by Mary Ellen McGonagle,
President, MEM Investment Research
In this episode of StockCharts TV'sThe MEM Edge, Mary Ellen reviews the bullish price action in the markets and shares her longer-term outlook. She also highlights the primary driver of last week's rally and which areas and stocks pushed the S&P 500 higher. In...
READ MORE
MEMBERS ONLY

Tech and Semis Leading from the Dip

by TG Watkins,
Director of Stocks, Simpler Trading
The market was severely overbought going into the new year, so some steam was left off, which, as TG Watkins notes, we can see in the breadth readings. Now with notable names in the tech space leading and taking off, its time to get back in and see if the...
READ MORE
MEMBERS ONLY
Economic Modern Family's Engine Idles While Growth Goes Fast and Furious
Let's get right to it. The charts and our tools are telling.
To start, I always look at moving averages and phases. Then I look at Real Motion and momentum to see if there is a divergence to price. After that, I check out our Leadership indicator which...
READ MORE
MEMBERS ONLY

Utilities' Unique Seasonal Powers: The Best Months to Invest
by Karl Montevirgen,
The StockCharts Insider
KEY TAKEAWAYS
* The Utilities sector has periods of cyclical outperformance
* Seasonality charts in StockCharts can identify which months Utilities are likely to outperform
* Analyzing a price chart of the XLU ETF can help time your entries so they coincide with seasonal patterns
The Utilities sector is known as a defensive...
READ MORE
MEMBERS ONLY

Sector Spotlight: Is the S&P 500 Facing a Double Top?
by Julius de Kempenaer,
Senior Technical Analyst, StockCharts.com
On this episode of StockCharts TV's Sector Spotlight, I look at asset class rotation and examine the continued preference for stocks over bonds. After that, I move on to sector rotation and the Technology sector, breaking it down into industry groups and plotting them on a Relative Rotation...
READ MORE
MEMBERS ONLY

The Case for a Tactical Stock Selloff
by David Keller,
President and Chief Strategist, Sierra Alpha Research
In this edition of StockCharts TV'sThe Final Bar, guest Adam Turnquist of LPL Financial lays out the case for a tactical selloff for stocks, as well as why long-term indicators remain constructive in early 2024. Dave breaks down the bearish momentum divergence prevalent in the technology sector, and...
READ MORE
MEMBERS ONLY

Larry's "Family Gathering" January 16, 2024 Recording

by Larry Williams,
Veteran Investor and Author
In this video, Larry digs into rate cuts and how they affect the markets. When interest rates are high, money is in circulation. He's been watching the rate of inflation; as he notes, an object in motion tends to stay on the same path. He also warns against...
READ MORE
MEMBERS ONLY

View The Large Cap - Small Cap Debate in a Direct Comparison on RRG
by Julius de Kempenaer,
Senior Technical Analyst, StockCharts.com
KEY TAKEAWAYS
* Using RRG to see Large-Cap vs Small-Cap sector rotation
* The current strength for Small-Cap stocks vs Large-Caps is evident
At the end of last year, I wrote a blog article about the relationship between Large-Cap and Equal-Weight sectors. It involved plotting the ratios of the large-cap sector ETFs...
READ MORE
MEMBERS ONLY

Sector Spotlight: RRG Showing Strong Rotation For Stocks in All Time Frames
by Julius de Kempenaer,
Senior Technical Analyst, StockCharts.com
KEY TAKEAWAYS
* Stocks Showing Relative Strength in All Time Frames on RRG
On this episode of StockCharts TV's Sector Spotlight, 2024's first episode, I dive into both Asset Class and Sector Rotation to set the stage for 2024. Today, I focus on a synchronized rotation of...
READ MORE
MEMBERS ONLY

MEM TV: The Easy Way to Uncover Stocks Poised to Outperform
by Mary Ellen McGonagle,
President, MEM Investment Research
In this episode of StockCharts TV'sThe MEM Edge, Mary Ellen takes a look at some of the items that drove price action last week. Growth stocks came roaring back for week two of 2024, which is great news for those that were believers last year. They can renew...
READ MORE
