MEMBERS ONLY
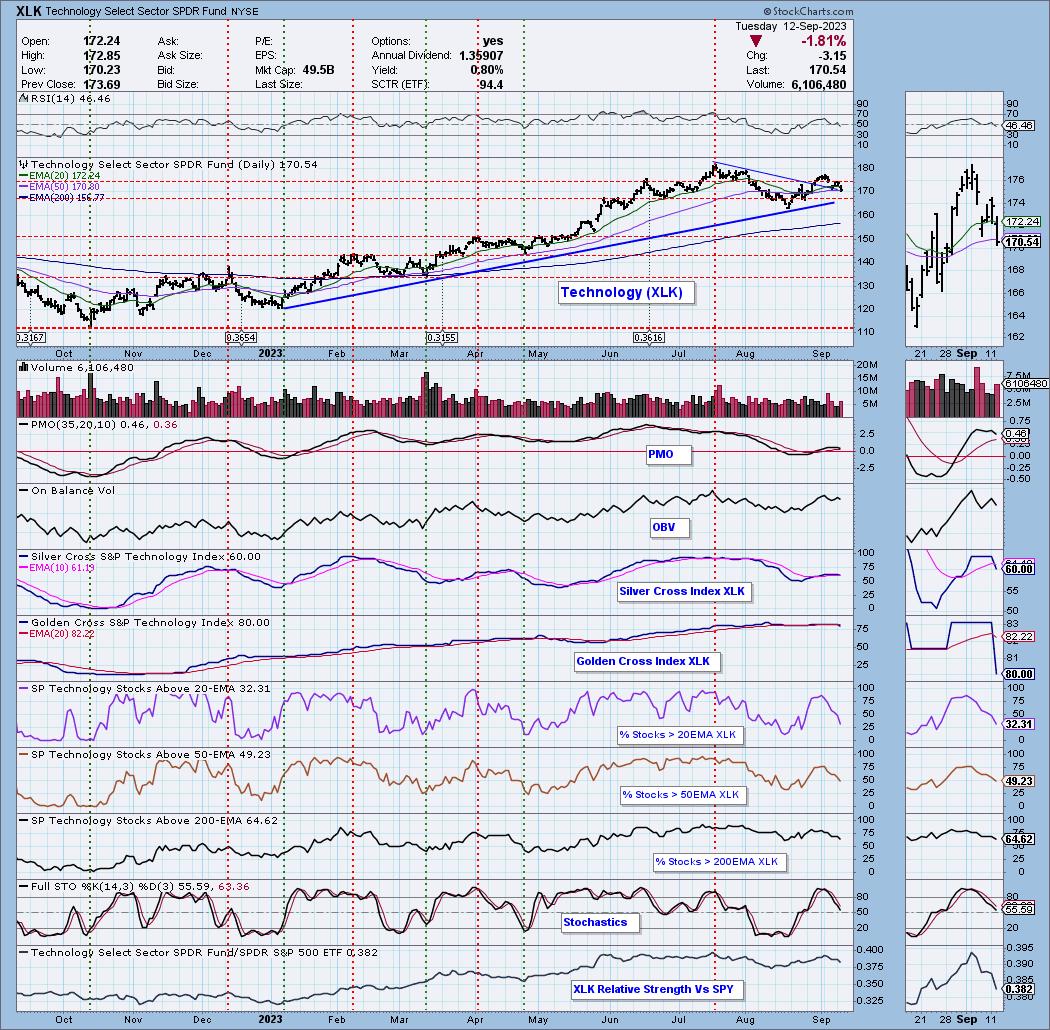
Technology, Last Man Standing... Falls

by Erin Swenlin,
Vice President, DecisionPoint.com
KEY TAKEAWAYS
* XLK "Bearish Shifts" Move IT and LT Bias to BEARISH
* XLK PMO Nearing Crossover SELL Signal
In Monday's DecisionPoint Trading Room we discussed that Technology (XLK) was the last one standing on our Bias Scoreboard with a Bullish Bias in both the intermediate term...
READ MORE
MEMBERS ONLY
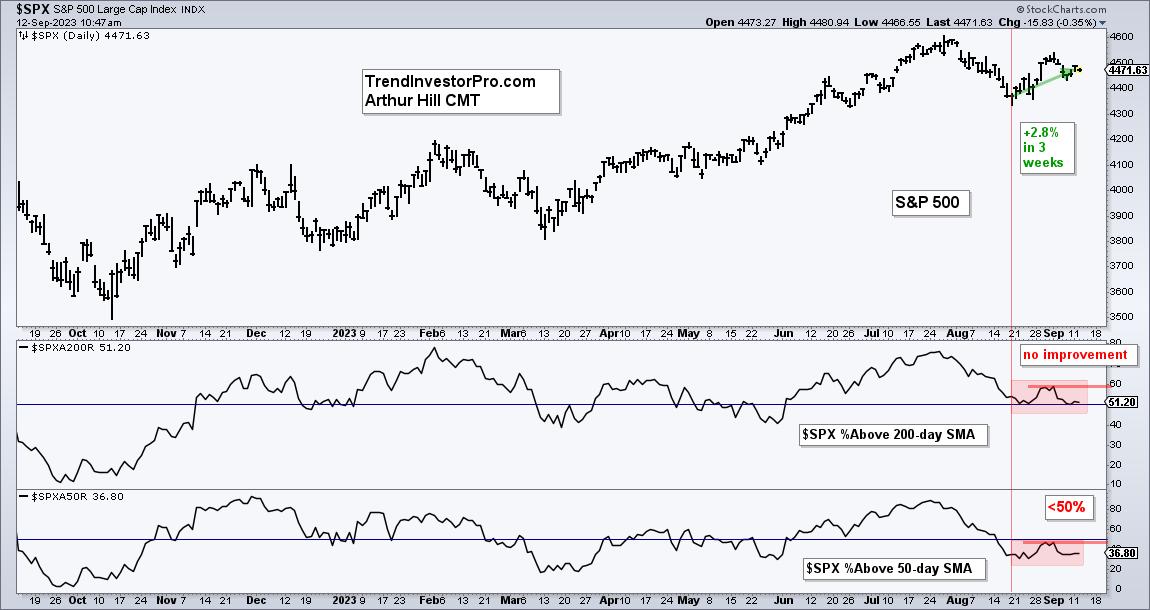
Breadth is Not Keeping Pace with the Bounce

by Arthur Hill,
Chief Technical Strategist, TrendInvestorPro.com
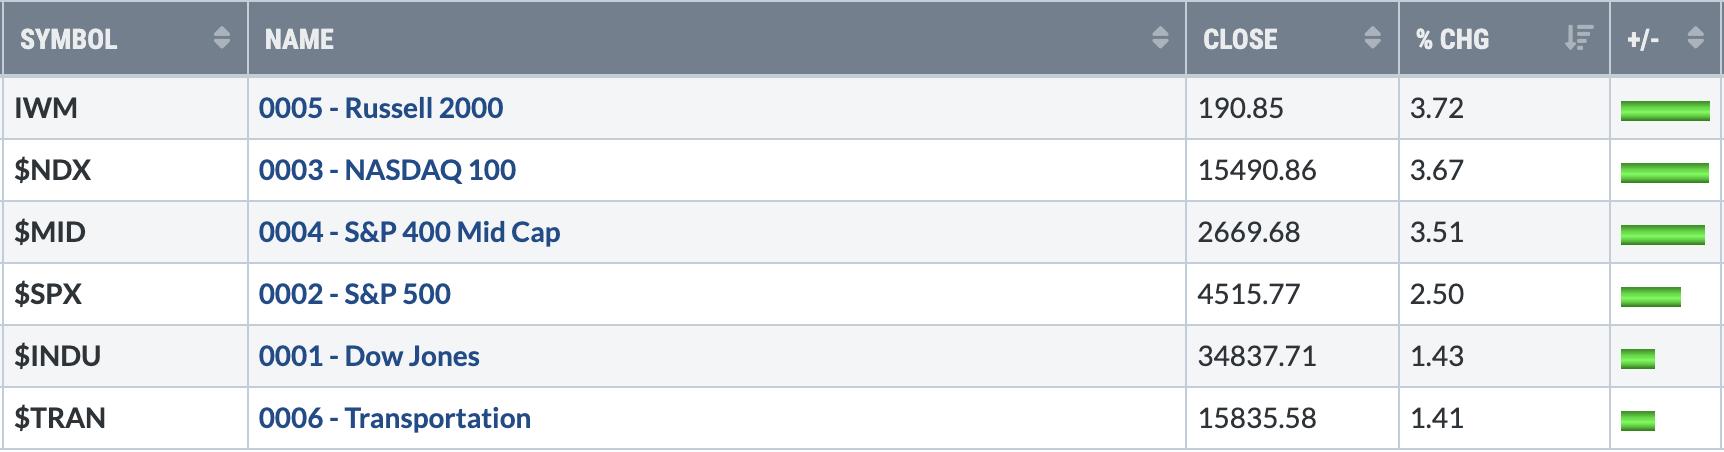
The S&P 500 SPDR bounced the last three weeks, but we did not see an improvement in breadth. Weak breadth is also reflected in performance for mid-caps and small-caps, which are lagging. Even so, SPY and QQQ are in short-term uptrends and I am watching the tech sector...
READ MORE
MEMBERS ONLY

DP Trading Room: Can Tech's Bullish Bias Hold?
by Erin Swenlin,
Vice President, DecisionPoint.com

by Carl Swenlin,
President and Founder, DecisionPoint.com
In this week's edition of The DecisionPoint Trading Room, Carl reviews the markets and shares the new DecisionPoint BIAS assessment list. Erin concentrates on Technology (XLK) and Utilities (XLU). Technology is only sector holding a bullish bias in the intermediate and long terms, will that hold up? Utilities...
READ MORE
MEMBERS ONLY
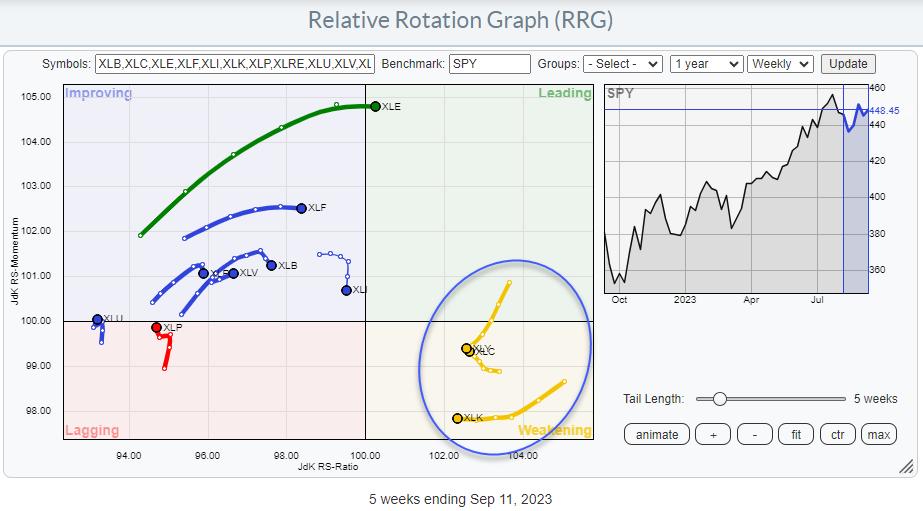
Looks Like a Strong Rotation to The Leading RRG Quadrant is Around the Corner for Three Sectors

by Julius de Kempenaer,
Senior Technical Analyst, StockCharts.com
KEY TAKEAWAYS
* Three Sectors Are Ready to Rotate Back Towards the Leading Quadrant
* Technology, Discretionary, and Communication Services Together Are Almost Half Of Total Market Cap
* Daily Tails for these sectors are supporting the looming positive rotation for their weekly counterparts
First of all, for those who are awaiting a...
READ MORE
MEMBERS ONLY

When Facing a Market Pullback, RUN THESE SCANS!

by David Keller,
President and Chief Strategist, Sierra Alpha Research
In this edition of StockCharts TV'sThe Final Bar, Dave recaps a big up day for TSLA and bearish engulfing pattern for energy stocks. He answers viewer questions on growth stocks during rising rate environment and shares two scans to identify potential opportunities during corrective periods.
This video originally...
READ MORE
MEMBERS ONLY

Week Ahead: NIFTY Forms a Key Support; These Sectors Set to Outperform

by Milan Vaishnav,
Founder and Technical Analyst, EquityResearch.asia and ChartWizard.ae
In the previous technical note, the importance of the support level of 19250 was discussed; it was mentioned that, if this level stands protected for NIFTY, the Index can rebound and inch higher towards 19700+ levels. While trading along these lines, the markets enjoyed trending sessions throughout the week. It...
READ MORE
MEMBERS ONLY
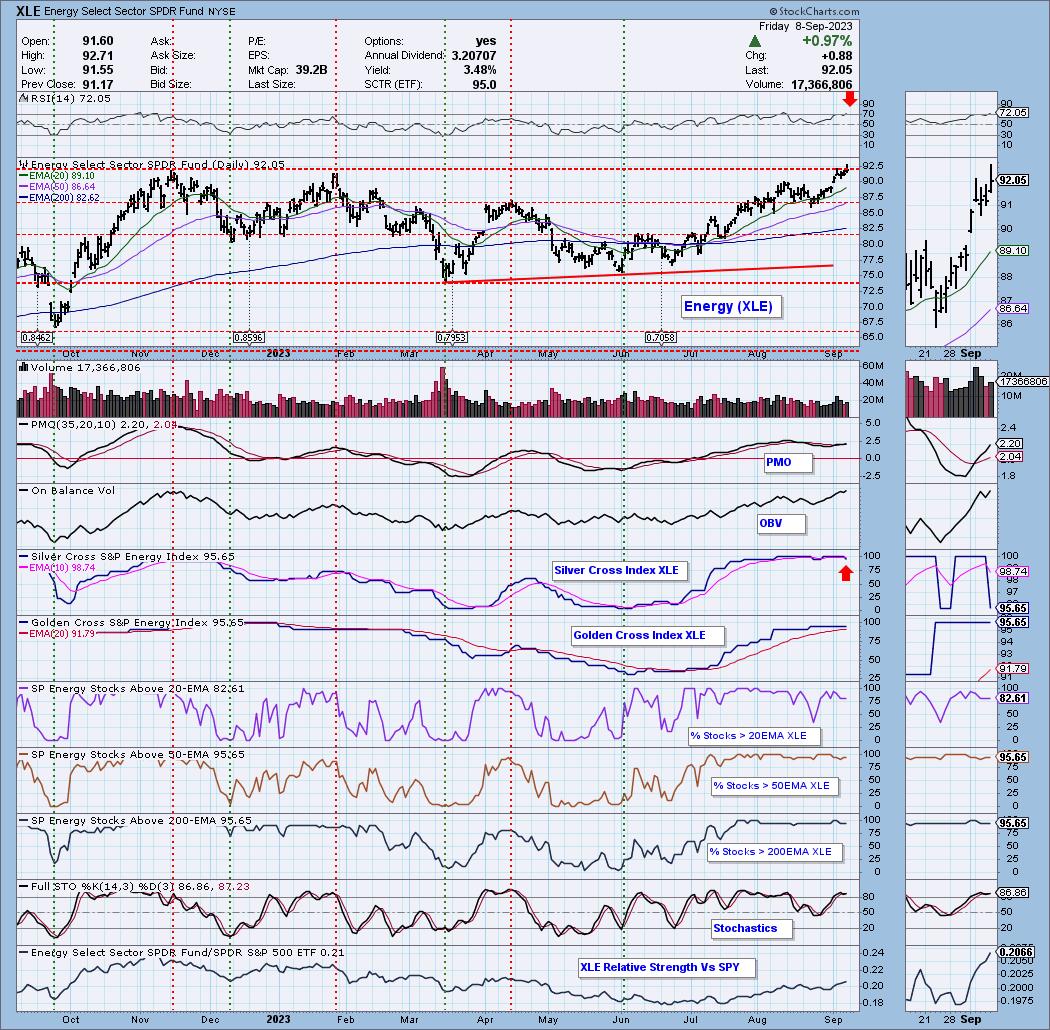
Energy Sector (XLE) Hits All-Time High, Should We Worry?
by Erin Swenlin,
Vice President, DecisionPoint.com
KEY TAKEAWAYS
* Energy (XLE) Logs New All-Time High
* XLE "Bearish Shift" on Silver Cross Index
The Energy sector (XLE) has been enjoying a rally throughout the summer. Today. it logged a new all-time high on a small breakout. While the sector looks impervious, there are a few concerns...
READ MORE
MEMBERS ONLY

Crucial Insights: How Rising Rates IMPACT You!
by David Keller,
President and Chief Strategist, Sierra Alpha Research
In this edition of StockCharts TV'sThe Final Bar, guest Willie Delwiche, CMT, CFA of Hi Mount Research outlines the long-term uptrend in interest rates and shares two sectors to focus on given the rising rate environment. Host David Keller, CMT tracks the sharp pullback for semiconductors and breaks...
READ MORE
MEMBERS ONLY

FORGET Valuations, REMEMBER the Charts!
by David Keller,
President and Chief Strategist, Sierra Alpha Research
In this edition of StockCharts TV'sThe Final Bar, guest Ari Wald, CFA, CMT of Oppenheimer & Co. shows how energy stocks are taking a leadership role, with high beta sectors still outperforming low volatility defensive stocks. Host David Keller, CMT tracks the latest downswing and describes a potential...
READ MORE
MEMBERS ONLY
The Key to the August Breakouts
by Arthur Hill,
Chief Technical Strategist, TrendInvestorPro.com
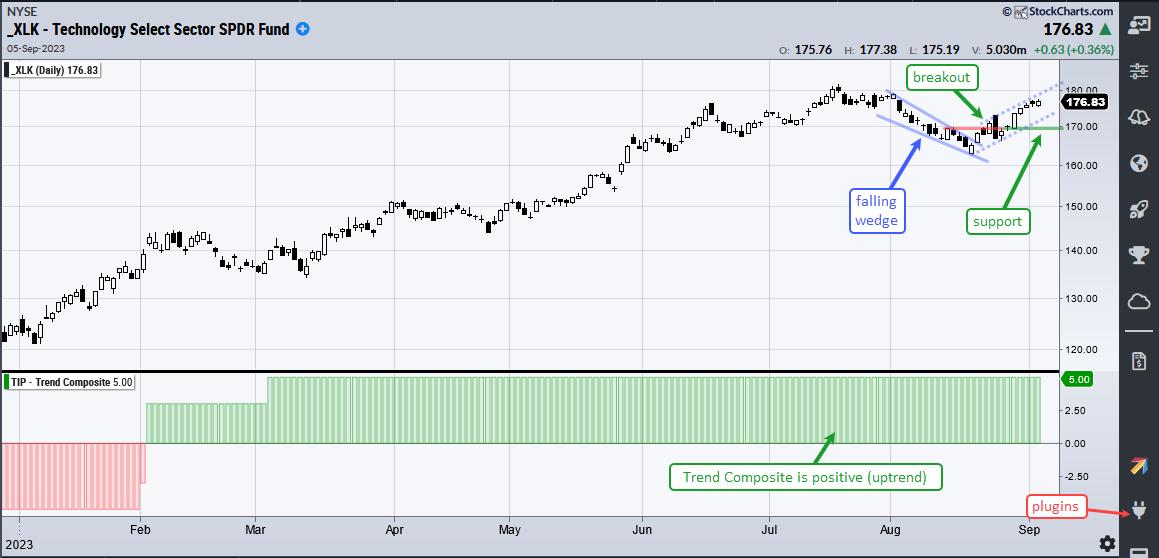
Stocks surged in the second half of August with several ETFs breaking out of corrective patterns, such as falling flags or falling wedges. Even though September is a seasonally weak month, these breakouts are bullish until proven otherwise. Today's commentary will analyze the breakout in the Technology SPDR...
READ MORE
MEMBERS ONLY

Sector Spotlight: Monthly RRG Shows Preference for Stocks Over Bonds
by Julius de Kempenaer,
Senior Technical Analyst, StockCharts.com
The month of August has come to an end, and that means a focus on long-term trends, using monthly Relative Rotation Graphs in combination with the finalized price (bar-)charts for August, on this episode of StockCharts TV's Sector Spotlight. Julius de Kempenaer assesses the rotations of asset...
READ MORE
MEMBERS ONLY
Here's My Latest View of Current Market Action

by Tom Bowley,
Chief Market Strategist, EarningsBeats.com
Hello to all my StockCharts supporters! First of all, thank you for your readership of my Trading Places blog, which is now in its 8th year. Also, thanks to all of you that watch my Trading Places LIVE shows that air on Tuesdays, Wednesdays, and Thursdays at 9:00am ET....
READ MORE
MEMBERS ONLY

Week Ahead: Important for NIFTY To Stay Above This Level; Expect Outperformance in These Pockets
by Milan Vaishnav,
Founder and Technical Analyst, EquityResearch.asia and ChartWizard.ae
The past five sessions of the week saw the Indian equities trading in a defined and narrower range. The first four sessions were seen leading the markets to a weekly loss, but the strong trading session on Friday saw NIFTY recouping its losses. The index oscillated in 234.90-point range,...
READ MORE
MEMBERS ONLY
You MUST Be Aware of This Seasonality Change
by Tom Bowley,
Chief Market Strategist, EarningsBeats.com
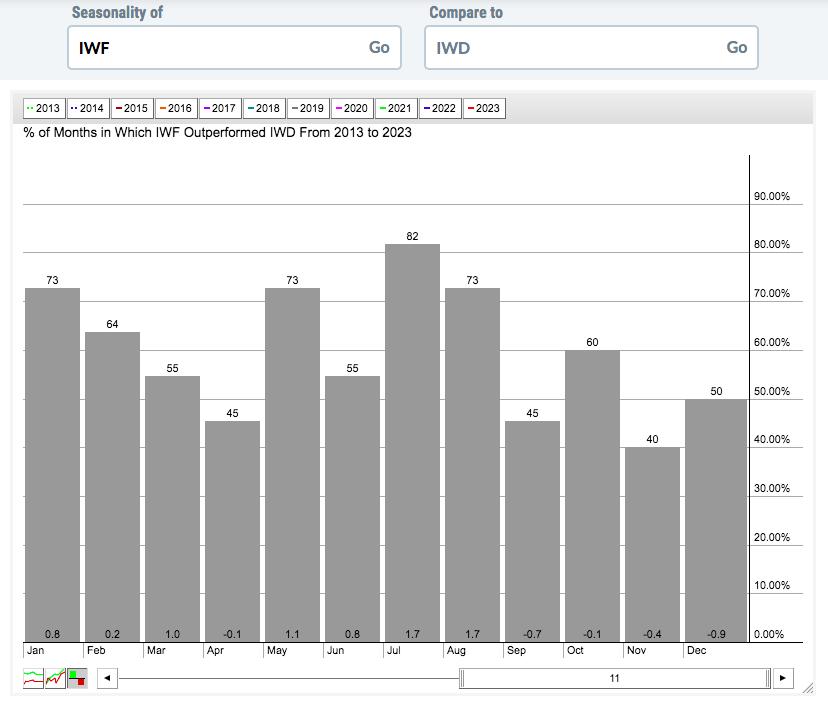
I love the seasonality information that StockCharts.com provides. It's important to keep in mind that seasonal tendencies are secondary indicators. I don't buy and sell based on them, because the price/volume combination will always be my primary indicator. But if technical indications point to...
READ MORE
MEMBERS ONLY
Plenty of Setups Emerge as Bulls Regain Control

by Mary Ellen McGonagle,
President, MEM Investment Research
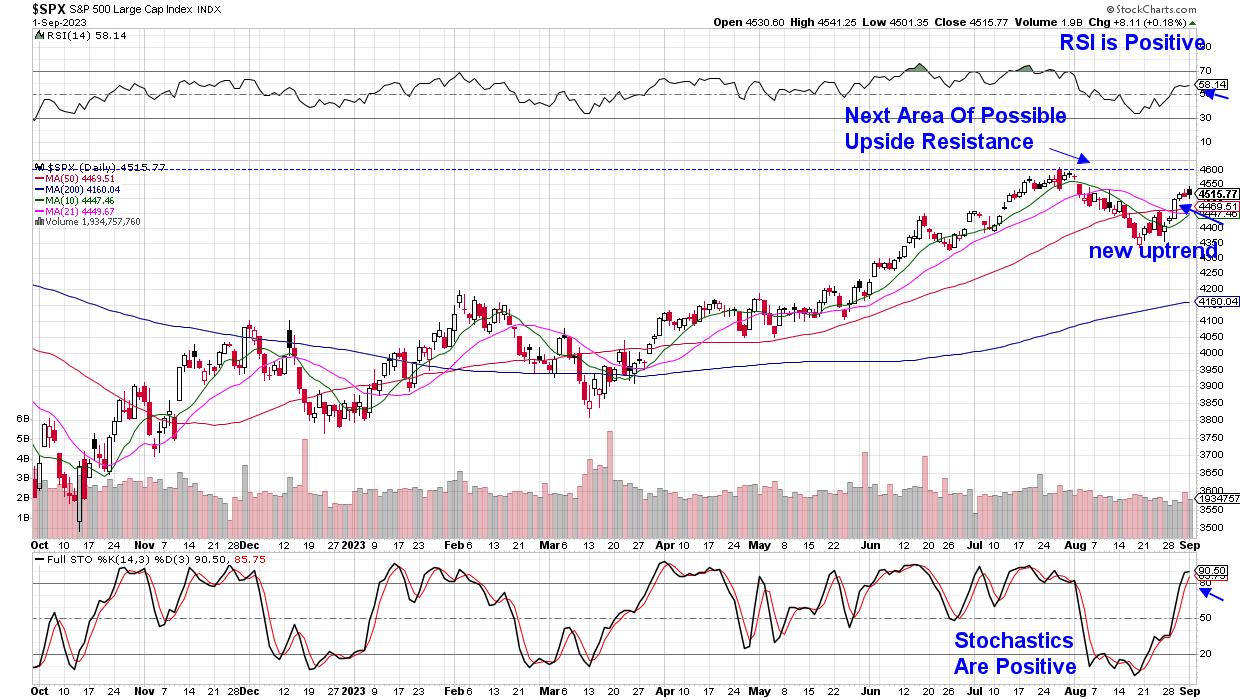
Last week, the broader markets regained their uptrend, with the S&P 500 and Nasdaq Indexes both closing above their key 50-day moving averages on Tuesday. In addition, the RSI and Stochastics turned positive as well. This price action indicates that the 3-week pullback which began in late July...
READ MORE
MEMBERS ONLY

Every One of These Breadth Conditions are SCREAMING Risk On!
by David Keller,
President and Chief Strategist, Sierra Alpha Research
In this edition of StockCharts TV'sThe Final Bar, TG Watkins of Simpler Trading shows how breadth conditions are very similar to previous bull market pullbacks. Dave focuses in on constructive setups in gold and crude oil, then highlights one semiconductor stock featuring a symmetrical triangle pattern.
This video...
READ MORE
MEMBERS ONLY
The Halftime Show: Deciphering the Fed After Jackson Hole

by Pete Carmasino,
Chief Market Strategist, Chaikin Analytics
In this week's edition of StockCharts TV'sHalftime, Pete reexamines the chart he posted before the Jackson Hole meeting; Chairman Powell validated his thinking that the Fed Policy will remain tight until the unemployment rate increases. He then gives a quick review of the SPX and the...
READ MORE
MEMBERS ONLY
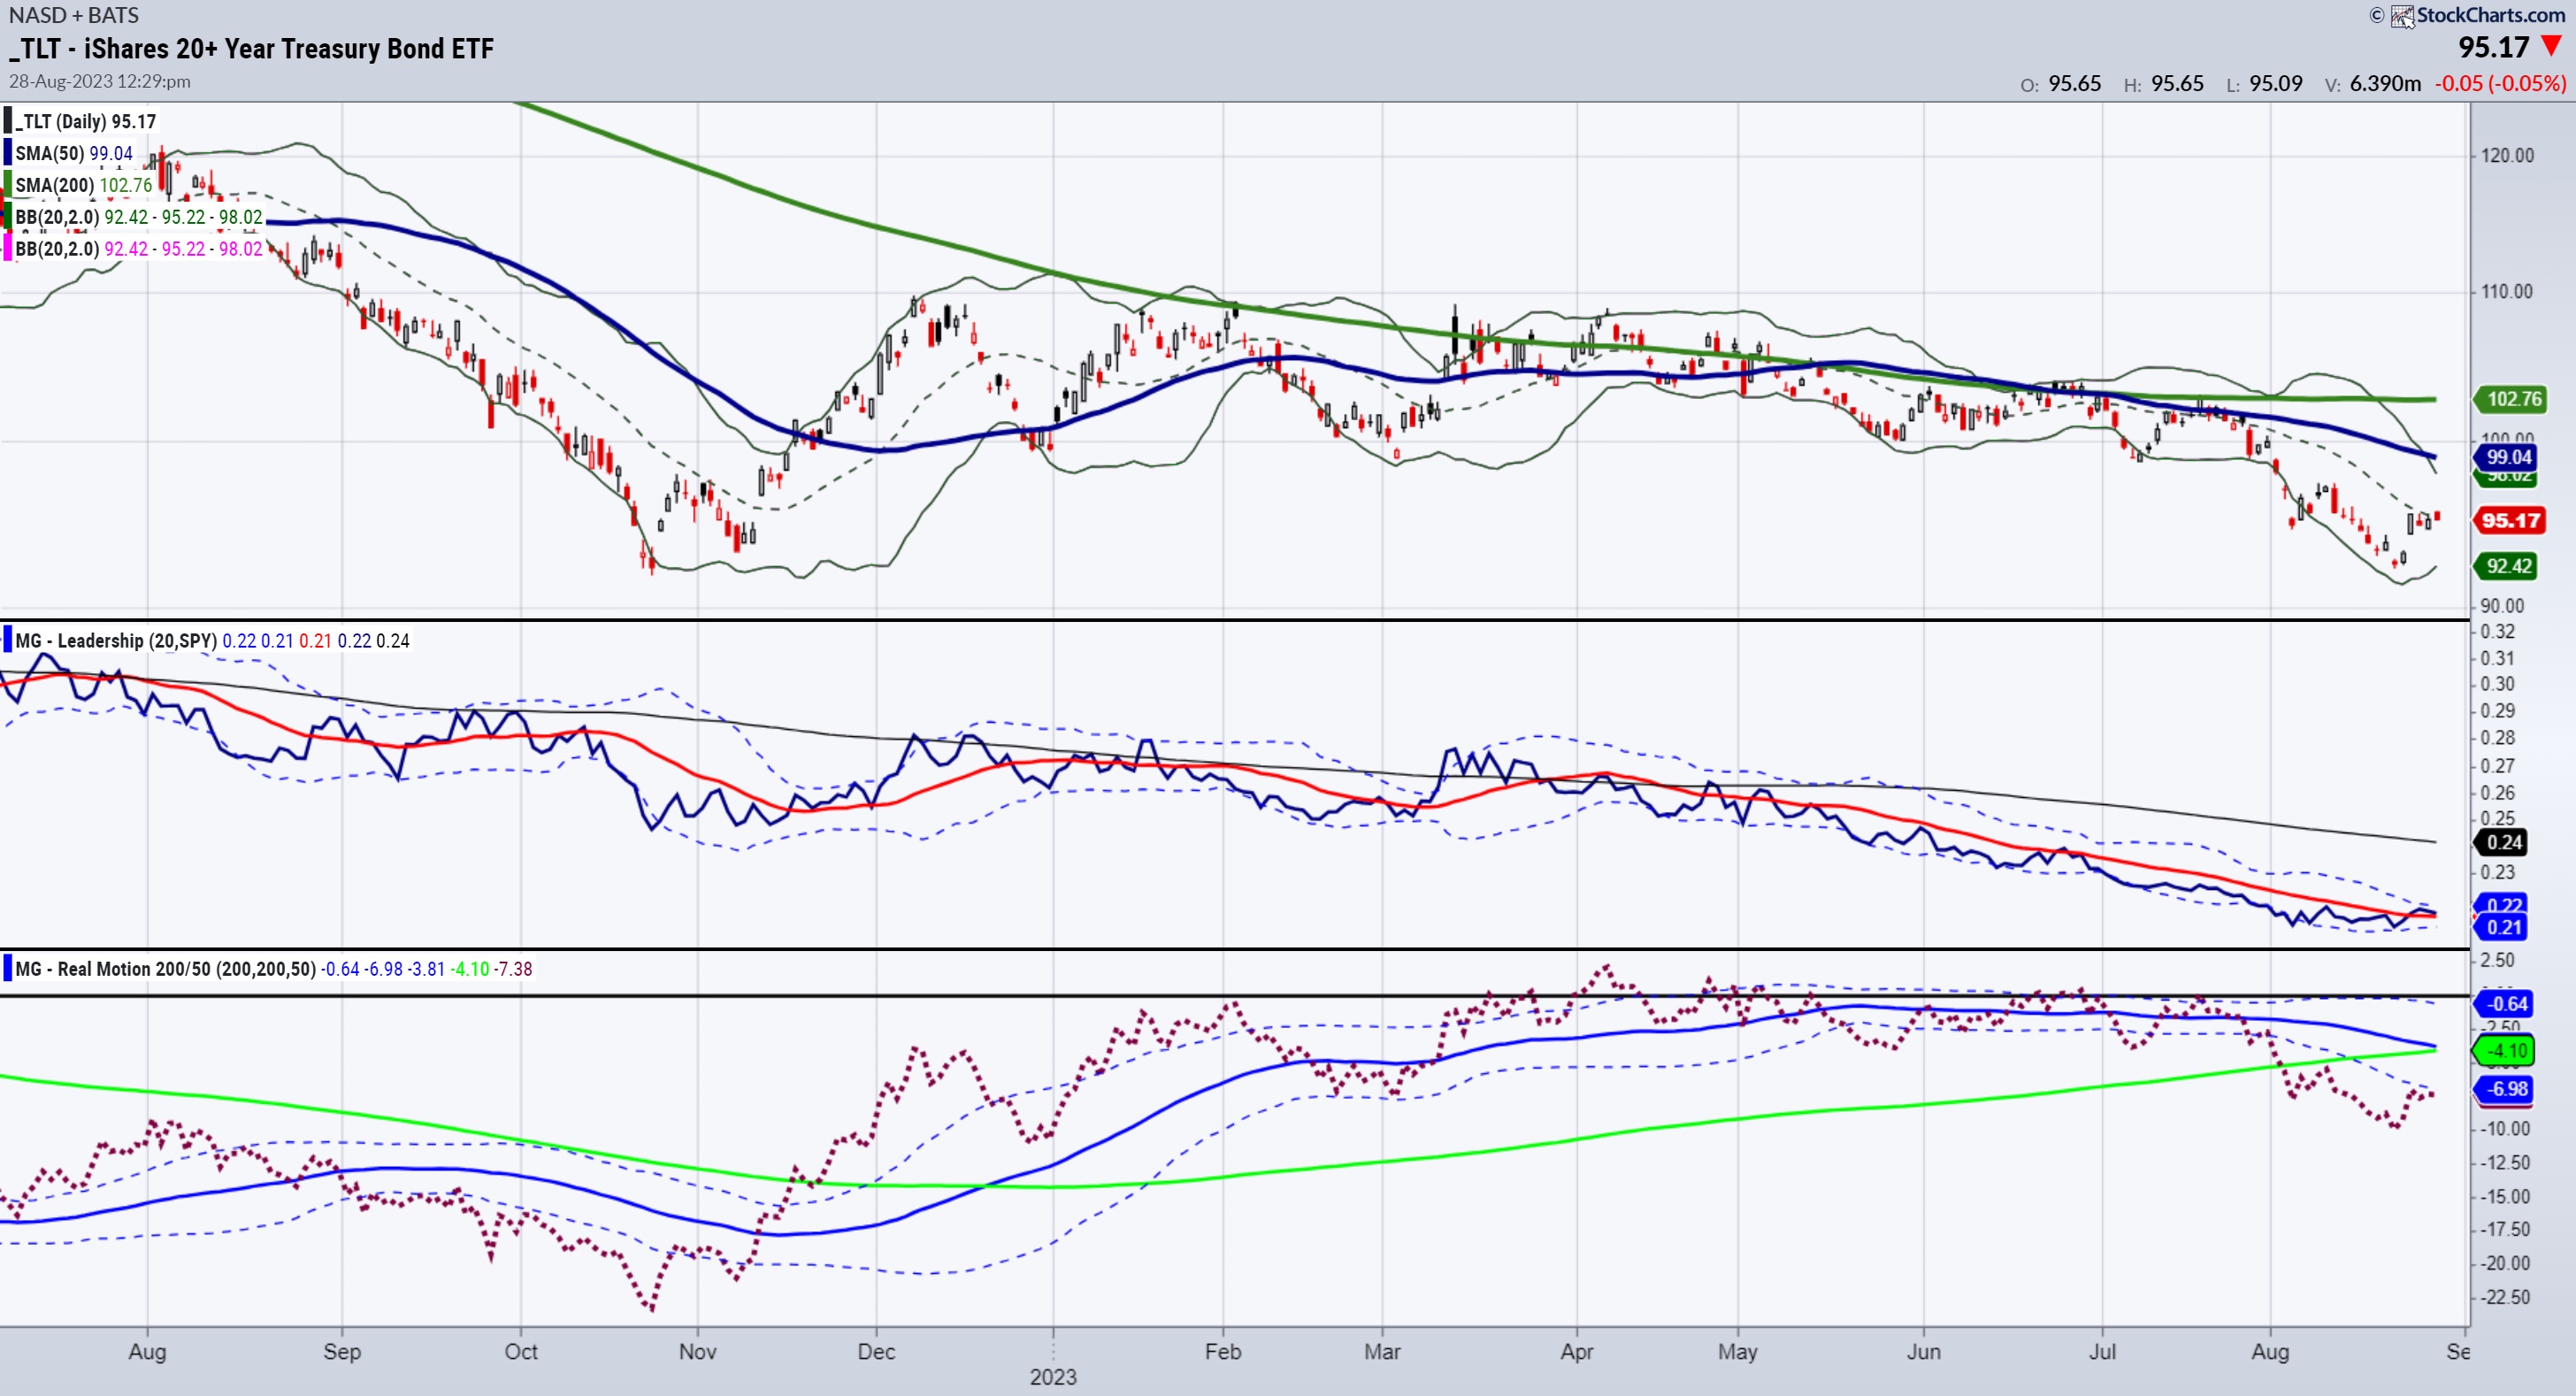
Bonds, Secular Bear Market, and the Impact on Small Caps
Bonds have had one of the worst years in modern times and one of the fastest rates of interest rate rises.
The good news is the market has absorbed the bond's performance. A better risk-on environment is when the SPY outperforms the long bonds. The same is true...
READ MORE
MEMBERS ONLY
DP Trading Room: New Market Bias Assessment Table
by Erin Swenlin,
Vice President, DecisionPoint.com
by Carl Swenlin,
President and Founder, DecisionPoint.com
In this week's edition of The DecisionPoint Trading Room, Carl introduces viewers to the new Market Bias table now included in the DecisionPoint Alert. This table covers all the major indexes, sectors, and select industry groups. He goes over how we determine the bias in the intermediate and...
READ MORE
MEMBERS ONLY

Watch These Four Horrible Charts in the Dow Jones Industrials Index
by Julius de Kempenaer,
Senior Technical Analyst, StockCharts.com
KEY TAKEAWAYS
* $INDU chart resting at double support and likely to bounce higher
* Outperform the index by avoiding four stocks
The Relative Rotation Graph above, which shows the rotations inside the DJ Industrials index, exhibits an evenly-spread-out universe of stocks. This is primarily the result of $INDU being a price-weighted...
READ MORE
MEMBERS ONLY
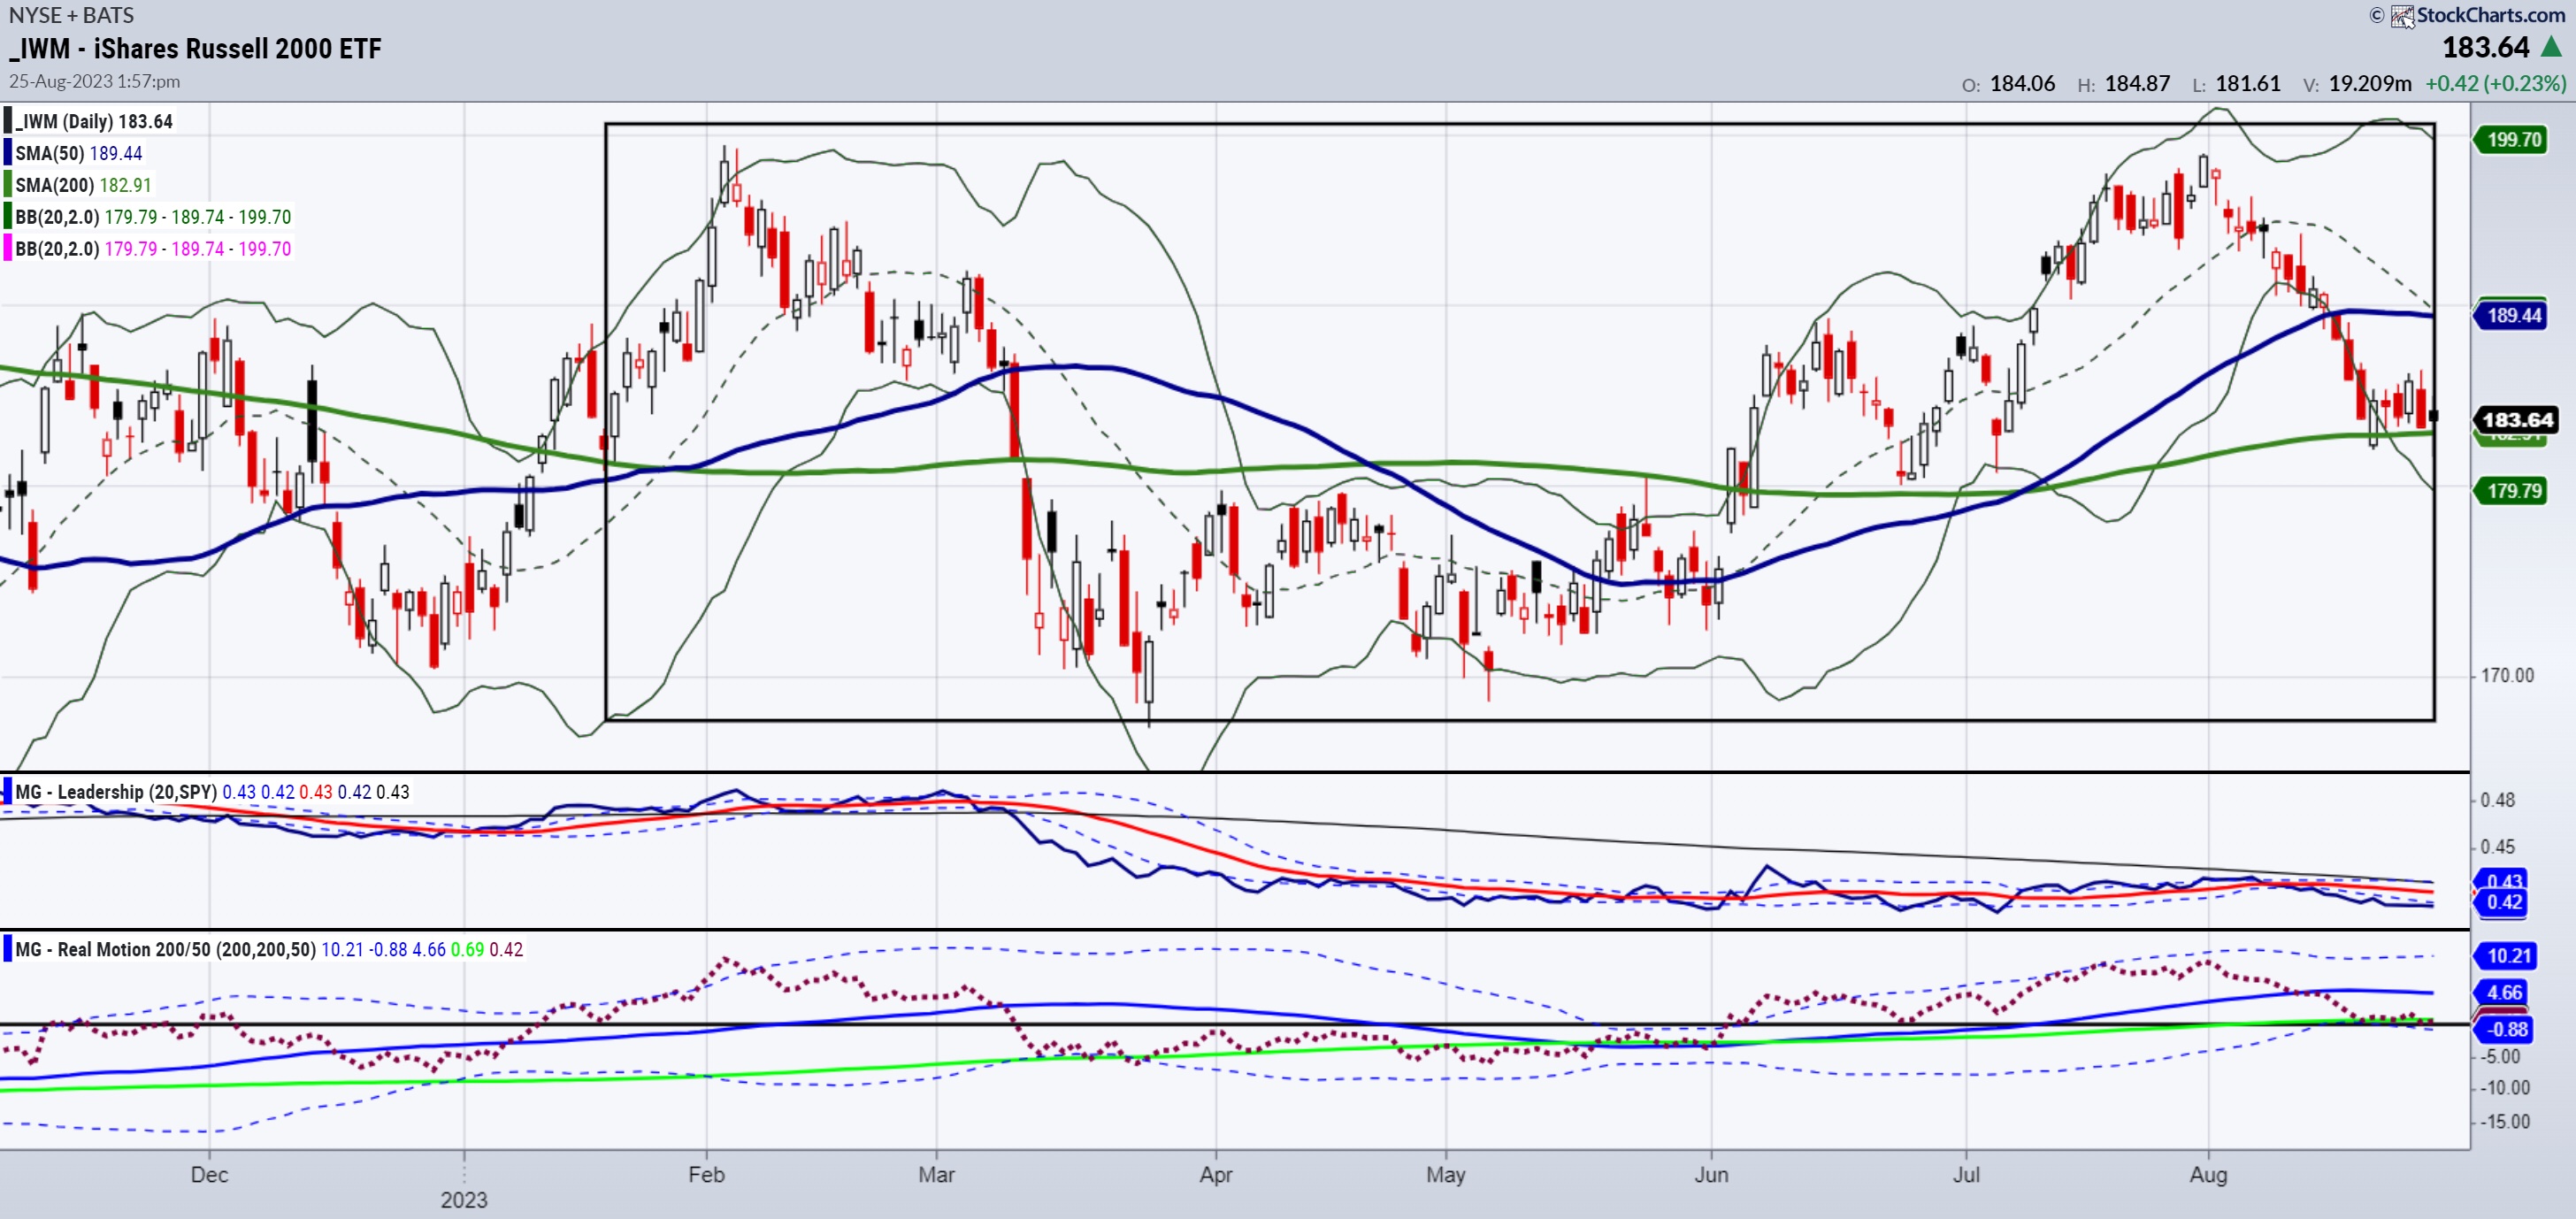
Can Small Caps Lead the Market Higher? A Video Analysis
Small caps, as measured by IWM, are key for the fall and heading into 2024. You can also look at the S&P 600 (SML).
IWM could be forming an inverted head-and-shoulders bottom, going back from the start of 2023. (See the rectangle area of the IWM chart). SPY...
READ MORE
