MEMBERS ONLY

StockCharts Insider: Why Should I Trade This Stock and Not That One?

by Karl Montevirgen,
The StockCharts Insider
Before We Dive In…
You’re looking at two stocks. Both seem promising. Both are starting to move. But which one do you trade? Spend five minutes on social media forums and you’ll see this question pop up everywhere. Many traders choose based on the story, the brand, or...
READ MORE
MEMBERS ONLY

Enterprise IT Spending Shows Signs of Cooling: A Bearish Setup In Cisco

by Tony Zhang,
Chief Strategist, OptionsPlay
Enterprise IT spending may be slowing. See how weakening momentum in CSCO stock and a bearish options setup could present trading opportunities....
READ MORE
MEMBERS ONLY

StockCharts Insider: The Hidden Risks of Learning Trading on Social Media
by Karl Montevirgen,
The StockCharts Insider
Before We Dive In…
Scroll through YouTube or TikTok and you’ll find that trading looks easy. Clean charts, fast profits, flashy lifestyles…it’s everywhere! Even my 12-year-old son, after a few weeks of studying candlestick patterns (without telling me), has become an “expert” who asked if he can...
READ MORE
MEMBERS ONLY

Pullback Playbook: Buy the Dip When Everyone Else Panics
by Tony Zhang,
Chief Strategist, OptionsPlay
Tony Zhang explains how to identify real dip-buying opportunities during market panic using a data-driven pullback filter. Learn a structured framework for recognizing when volatility may be creating a reversal setup....
READ MORE
MEMBERS ONLY
This RSI Setup Could Be Your First Entry After the Breakout

by Joe Rabil,
President, Rabil Stock Research
Joe Rabil shows how a specific RSI setup can help traders identify the first pullback entry after a breakout. He also reviews S&P 500 volatility, sentiment, QQQ, IWM, and several stock setups....
READ MORE
MEMBERS ONLY

Navigating Global Uncertainty with Coinbase (COIN)
by Tony Zhang,
Chief Strategist, OptionsPlay
Cryptocurrency prices have been under pressure. Here's a bear put spread options setup for a short-term bearish trade in COIN....
READ MORE
MEMBERS ONLY

Sector Momentum Favors Defense; QQQ Yet To Break; Split NDX Breadth

by Arthur Hill,
Chief Technical Strategist, TrendInvestorPro.com
The stock market is clearly in defensive mode but QQQ is still holding up, and its long-term breadth still hasn't turned bearish. Arthur Hill's analysis identifies the key levels to watch....
READ MORE
MEMBERS ONLY

StockCharts Insider: The Missing Step in Ichimoku Cloud Breakout Strategies
by Karl Montevirgen,
The StockCharts Insider
Before We Dive In…
Ichimoku Cloud breakouts can be an incredibly effective way to jump into a trend but only if you follow the right steps when pulling the trigger. You can easily find these breakouts while fine-tuning your criteria using StockCharts’ Updated Scan Filters. However, if you simply focus...
READ MORE
MEMBERS ONLY

The "AI Bubble" Didn't Burst. It Went on Sale.
by Tony Zhang,
Chief Strategist, OptionsPlay
Tony Zhang discusses a bullish counter-trend options setup for Amazon's stock. Here's how he found the trade and why he's seeing a high-conviction contrarian play....
READ MORE
MEMBERS ONLY
RSI Divergences Can Signal Major Tops — But Only If Confirmed!

by David Keller,
President and Chief Strategist, Sierra Alpha Research
RSI divergences can warn of potential major tops, but only if confirmed by breakdown signals. David Keller walks through DG, GOOGL, AT&T, and the S&P 500 to show what must happen before a divergence becomes actionable....
READ MORE
MEMBERS ONLY

Bottom Fishing or Breakdown? How to Spot a True Trend Reversal
by David Keller,
President and Chief Strategist, Sierra Alpha Research
When high-flying stocks tumble, is it a buying opportunity or the start of a deeper decline? Dave Keller, CMT, uses Alaska Air as a case study to show how momentum divergences and moving averages can confirm a true bottom—then applies the framework to PLTR and COIN....
READ MORE
MEMBERS ONLY

StockCharts Insider: Turning Sector Drill-Down into an Actionable Workflow
by Karl Montevirgen,
The StockCharts Insider
Before We Dive In…
The Sector Drill-Down is a popular and incredibly useful tool for observing relative sector rankings at a glance. But the data itself doesn’t give you a workflow, let alone a strategy. While many traders glance at the rankings and click a few charts, hoping something...
READ MORE
MEMBERS ONLY
How to Trade Trend Pullbacks with OptionsPlay
by Tony Zhang,
Chief Strategist, OptionsPlay
Tony Zhang shares his battle-tested trend following options strategy! Discover how the OptionsPlay Strategy Center automatically ranks call options, spreads, and credit trades to help you find the best risk-reward opportunities in minutes....
READ MORE
MEMBERS ONLY

Breaking Out: Cigna's Post-Earnings Recovery Just Getting Started
by Tony Zhang,
Chief Strategist, OptionsPlay
Cigna (CI) breaks out above $280 after a post-earnings selloff. In this article, Tony breaks down a compelling bullish options trade setup....
READ MORE
MEMBERS ONLY

StockCharts Insider: Ichimoku’s Forgotten Line - The Chikou Span (and How It Can Help You)
by Karl Montevirgen,
The StockCharts Insider
Before We Dive In…
The Chikou Span is arguably the most overlooked, most underestimated, and most underutilized part of the Ichimoku Cloud.
At first glance, it doesn’t look like much. It simply takes today’s closing price and plots it 26 periods back. If you’re focused on what’...
READ MORE
MEMBERS ONLY
NEW StockCharts Scan Engine Update — Build Powerful Stock Scans Without Writing Code!

by Grayson Roze,
Chief Strategist, StockCharts.com
Grayson Roze reveals a powerful Scan Engine update that makes building advanced stock scans easier than ever. See how the new Scan Components panel lets you create custom scans and alerts using pre-built criteria—no code required....
READ MORE
MEMBERS ONLY

How to Insure Against an Equity Market Reset
by Tony Zhang,
Chief Strategist, OptionsPlay
Explore how a bear put spread on SPY can provide downside protection during a normal market consolidation with a defined risk-to-reward profile....
READ MORE
MEMBERS ONLY

Equal Weight vs. Cap Weight: Why One Choice Changed the Outcome

by Julius de Kempenaer,
Senior Technical Analyst, StockCharts.com
Julius de Kempenaer breaks down a real-world portfolio experiment from 2025 that shows how weighting decisions can dramatically change performance. See how equal- and cap-weight approaches produced very different results and why it matters for portfolio construction today....
READ MORE
MEMBERS ONLY
Top 10 Charts Revealed -- February 2026 Market Shifts
by Grayson Roze,
Chief Strategist, StockCharts.com
by David Keller,
President and Chief Strategist, Sierra Alpha Research
Grayson Roze and Dave Keller break down the top 10 charts to watch for February, exposing where leadership is changing and where new strength is emerging. From rotation across sectors to key breakouts and bottoming patterns, these charts highlight what’s actually driving the market right now....
READ MORE
MEMBERS ONLY

Risk Assets Are Under Siege; Beware!

by Tom Bowley,
Chief Market Strategist, EarningsBeats.com
These charts indicate the stock market is showing warning signs. Tom Bowley analyzes the price action in semiconductors, cryptocurrencies, rotation away from growth, and sentiment measures to make his case. ...
READ MORE
MEMBERS ONLY

Finance SPDR Takes a Hit, but Maintains Uptrend as Trading Setup Emerges
by Arthur Hill,
Chief Technical Strategist, TrendInvestorPro.com
In the last few weeks, the Financials sector took a hit. However, it's oversold within a long-term uptrend. Find out what indicators Arthur Hill uses to identify an ideal long setup....
READ MORE
MEMBERS ONLY
Morgan Stanley’s Momentum Entry Setup
by Tony Zhang,
Chief Strategist, OptionsPlay
Morgan Stanley shows strong relative strength. Learn how a bullish trend-following setup and a bull call spread can target upside with limited risk....
READ MORE
MEMBERS ONLY

StockCharts Insider: How to Read Wall Street’s Risk-On Playbook
by Karl Montevirgen,
The StockCharts Insider
Before We Dive In…
The Street says it’s risk-on. Sector charts back that up. But, at the time of writing, the stocks that usually lead real bull runs are only doing… okay. So, where’s all the money going? Which corner of risk is capital flowing into? Here’s...
READ MORE
MEMBERS ONLY

Ignore the Headlines — This Is Where the Money Is Going!
by Tom Bowley,
Chief Market Strategist, EarningsBeats.com
Markets were mixed last week, but Tom Bowley explains why the real story isn’t in the headlines. He breaks down where money is rotating right now — and why those early-January signals matter more than index levels....
READ MORE
MEMBERS ONLY
Market Leadership Is Narrowing — What’s Still Working?

by Mary Ellen McGonagle,
President, MEM Investment Research
Mary Ellen McGonagle breaks down how market leadership is narrowing as more areas lose strength. She highlights the sectors and stocks that are working and the signals investors should be watching in an increasingly selective market....
READ MORE
MEMBERS ONLY

Is History Repeating Itself? These Signals Are Concerning
by Tom Bowley,
Chief Market Strategist, EarningsBeats.com
Major indices remain near record levels as key market relationships begin to resemble conditions that can come before market tops. Tom Bowley breaks down the signals Wall Street is sending beneath the surface and explains why this familiar setup deserves close attention....
READ MORE
MEMBERS ONLY
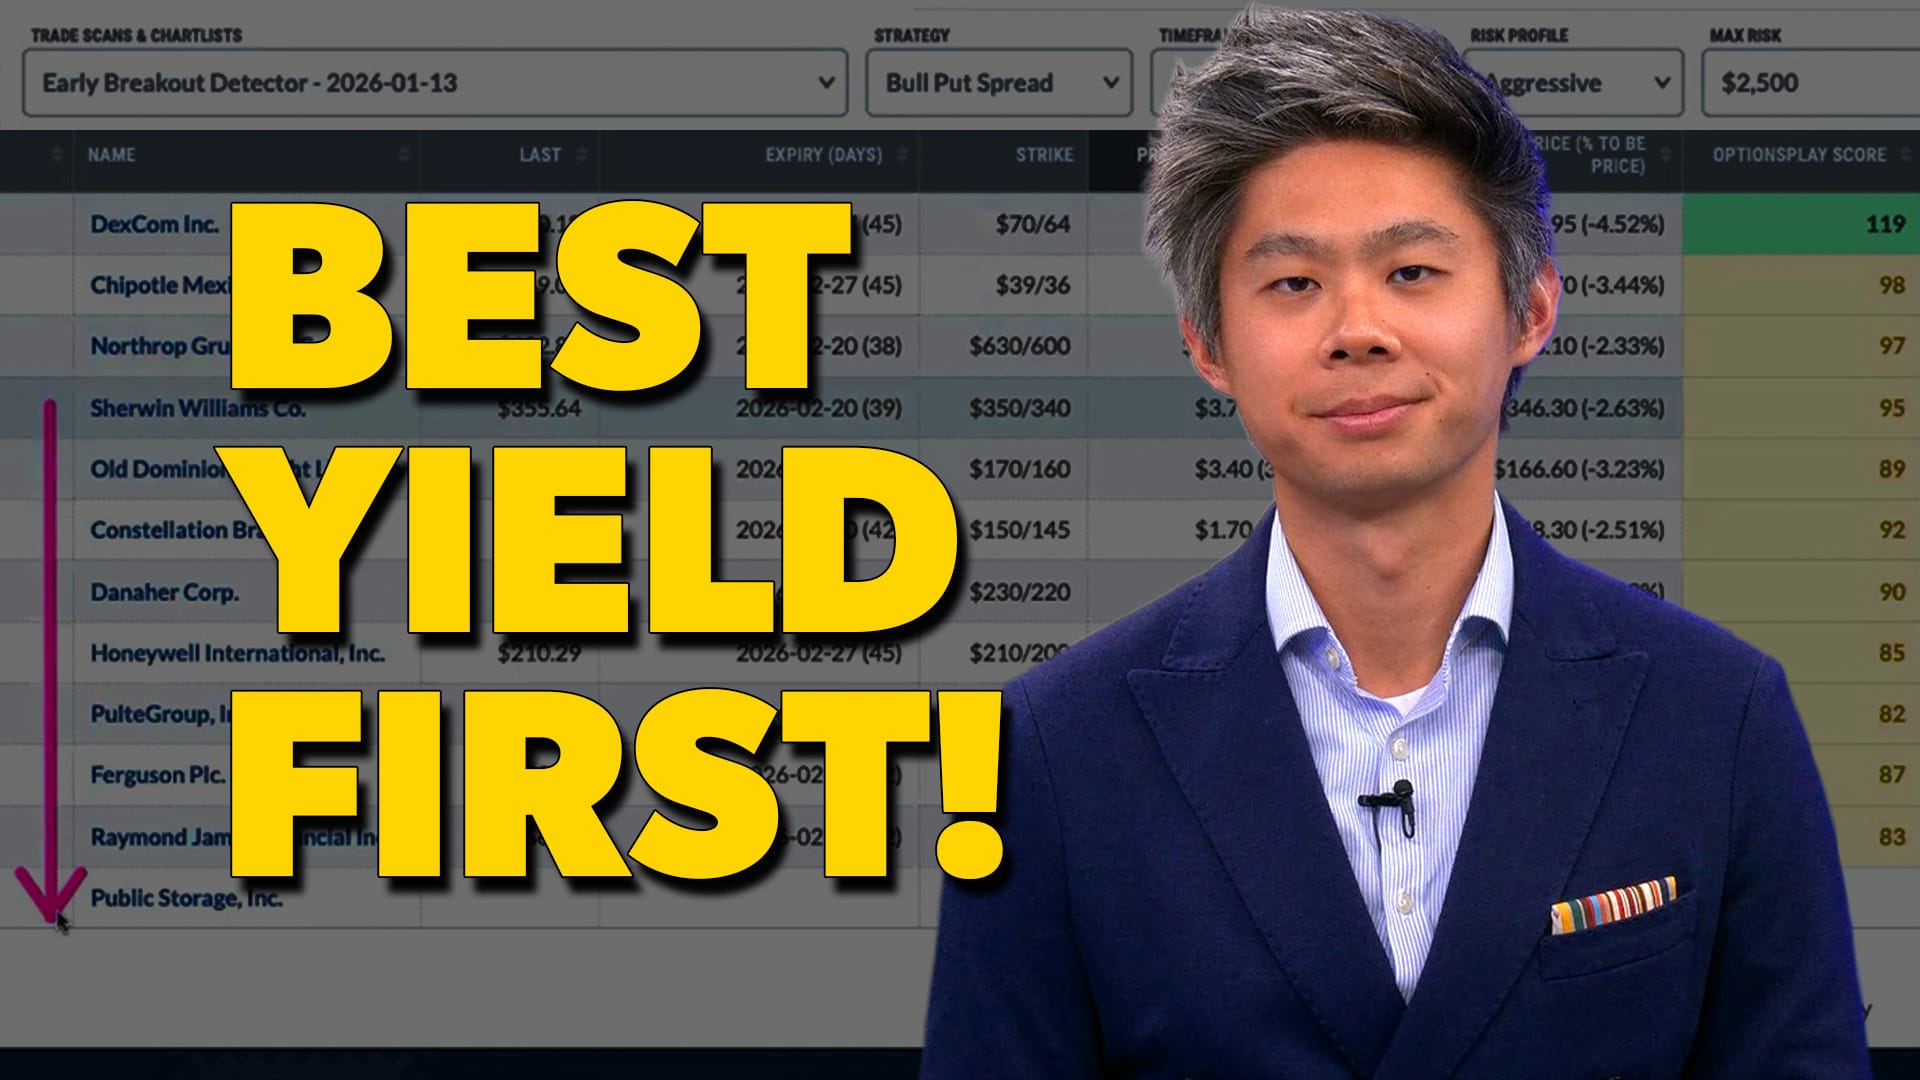
Find the Best Options Trades Without Wasting Hours!
by Tony Zhang,
Chief Strategist, OptionsPlay
Tony Zhang explains how to find the best-yielding options strategies with StockCharts’ OptionsPlay Strategy Center. Learn how to rank cover calls, cash-secured puts, and spreads in real time to trade more efficiently and with greater confidence....
READ MORE
MEMBERS ONLY

StockCharts Insider: The Untapped Edge Hiding in Your Moving Averages
by Karl Montevirgen,
The StockCharts Insider
Before We Dive In…
Markets don’t always trend. They coil, surge, and then launch in one direction or another. The trick is being able to spot each phase and to use that information to act. A lone moving average can hint at direction, but it won’t tell you...
READ MORE
MEMBERS ONLY
5 Breadth Signals Powering the 2026 Breakout and What Would Break It
by David Keller,
President and Chief Strategist, Sierra Alpha Research
David Keller breaks down five key breadth signals confirming the market’s 2026 breakout. At the same time, he also examines what each indicator could do that would signal weakening participation and a potential breakdown....
READ MORE
MEMBERS ONLY
New Scan Filters — A Faster Way to Find the Right Stocks!
by Grayson Roze,
Chief Strategist, StockCharts.com
Grayson Roze introduces new filtering tools for the Sample Scan Library that make scanning faster and more focused. See how this update can help you narrow results and find stronger stock ideas with less effort....
READ MORE
MEMBERS ONLY

The State of the Market: Trend, Breadth & Leadership, Plus a Trend-Momentum Strategy
by Arthur Hill,
Chief Technical Strategist, TrendInvestorPro.com
The S&P 500 is in a clear uptrend with strong breadth, and three sectors leading the trend are Finance, Health Care, and Industrials. Arthur Hills shows you how to use a top-down approach to identify oversold stocks within uptrends....
READ MORE
MEMBERS ONLY

The Market is Up, But the Warning Signs Are Adding Up!
by Tom Bowley,
Chief Market Strategist, EarningsBeats.com
Markets opened 2026 with solid gains, but Tom Bowley explains why several warning signs beneath the surface deserve attention. He breaks down leadership trends and intermarket relationships that are failing to confirm the rally, highlighting what traders should keep their eyes on....
READ MORE
MEMBERS ONLY

StockCharts Insider: How To Spot a Stock That’s Wound Tight and Ready to Break (Part 1)
by Karl Montevirgen,
The StockCharts Insider
Before We Dive In…
Every trader knows that strong breakouts tend to make money as long as you’re on the right side of the move. The tricky part? Knowing when that breakout is likely to happen. What I’m about to give you is a framework for measuring volatility,...
READ MORE
MEMBERS ONLY

StockCharts Insider: A Renko Technique to Fine-Tune Your Dollar-Cost Averaging
by Karl Montevirgen,
The StockCharts Insider
Who This Article is For: This article is for the long-term investor who isn’t a full-on expert chartist but wants to know enough to use it to fine-tune their dollar cost averaging strategy. If this is you, read on.
Before We Dive In…
Not every long-term investor wants to...
READ MORE
MEMBERS ONLY

Maduro’s Fall, Energy’s Rise: Oil & XLE Are Back in Focus, Key Price Levels to Watch
Energy stocks are off to a good start, and after recent geopolitical headlines, you may want to consider this long-time underperforming sector. A break above key technical resistance levels will determine if energy stocks have staying power....
READ MORE
MEMBERS ONLY

Strong Start to 2026, But Will Nifty Hold the Momentum?

by Milan Vaishnav,
Founder and Technical Analyst, EquityResearch.asia and ChartWizard.ae
Nifty's technical setup remains in a strong uptrend, trading above key moving averages. However, momentum seems to have moderated, suggesting possible fatigue. Here's a technical deep dive to prepare you for the coming week....
READ MORE