MEMBERS ONLY
MEM TV: NVIDA is Setting Up To SURGE

by Mary Ellen McGonagle,
President, MEM Investment Research
In this episode of StockCharts TV'sThe MEM Edge, Mary Ellen reviews the key drivers for this week's volatile period, including Core PCE and GDP numbers. She takes a look at where the S&P 500 and NASDAQ closed for the week and whether it'...
READ MORE
MEMBERS ONLY
Key Breadth Indicator Flashes Buy Signal for Nasdaq 100

by David Keller,
President and Chief Strategist, Sierra Alpha Research
In this edition of StockCharts TV'sThe Final Bar, Dave opens The Final Bar mailbag to answer viewer questions on the Nasdaq Bullish Percent Index, the value of long-term technical analysis techniques, how sentiment indicators relate to the market trend, and how the CMT program helped him improve his...
READ MORE
MEMBERS ONLY
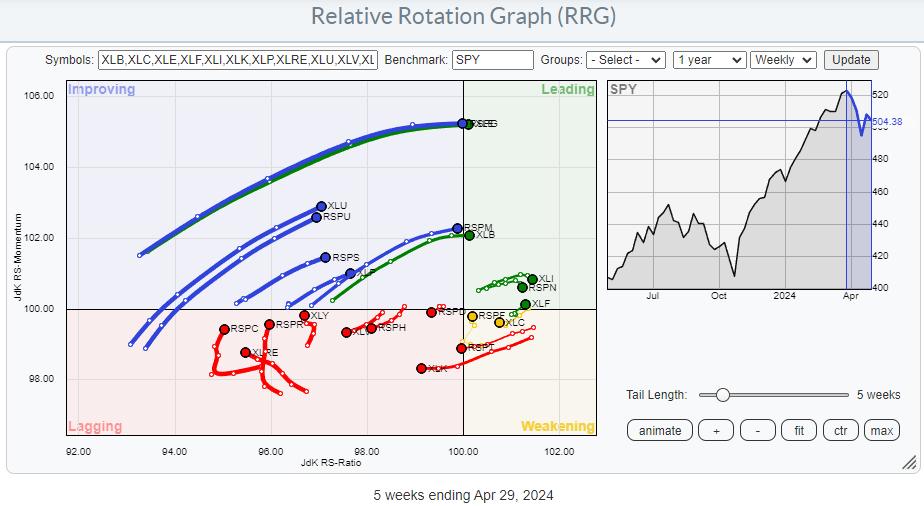
Diverging Tails on This Relative Rotation Graph Unveil Trading Opportunities

by Julius de Kempenaer,
Senior Technical Analyst, StockCharts.com
KEY TAKEAWAYS
* Comparing equal-weighted and cap-weighted sectors on a Relative Rotation Graph can offer interesting insights
* When the trajectory of the tails and their position on the chart differ significantly, further investigation is warranted
* At the moment, two sectors are showing such divergences
All on the Same Track... or?
The...
READ MORE
MEMBERS ONLY

AMD at a Crossroads: Buy Now or Brace for More Losses?

by Karl Montevirgen,
The StockCharts Insider
KEY TAKEAWAYS
* AMD stock plunged 7% after slightly topping Wall Street estimates
* There are three crucial turnaround levels to closely close monitor
* Momentum is key when deciding whether to go long, wait, or call off the trade
Advanced Micro Devices (AMD) slightly topped Wall Street's earnings and guidance...
READ MORE
MEMBERS ONLY

Time for a Pause in the Ongoing Dollar Bull Market? Or Full Steam Ahead?

by Martin Pring,
President, Pring Research
I last wrote about the dollar in December, where I came to the conclusion that a limited rally was a likely possibility in what was assumed to be a primary bull market. I am still of the view that the bull market is alive and well, but it's...
READ MORE
MEMBERS ONLY
Gain AN EDGE Over Other Traders with ADX/DI

by Joe Rabil,
President, Rabil Stock Research
On this week's edition of Stock Talk with Joe Rabil, Joe breaks down the differences between buyers and sellers, and shows how the ADX/DI can be used in three different ways: The action phase, low ADX period and an expansion phase. Understanding this indicator will give you...
READ MORE
MEMBERS ONLY

35 Years of Crude Oil Forecasting the Future | Focus on Stocks: May 2024

by Larry Williams,
Veteran Investor and Author
All You Need to Know About Crude Oil and the Future
Gold, black gold, is what Crude Oil has become. The entire world runs on energy. 98% of our cars and transportation, our lights, the device you are using to read this... virtually everything we can do is thanks to...
READ MORE
MEMBERS ONLY

SPY's Pullback Continues: How To Know When It's Over

by Jayanthi Gopalakrishnan,
Director of Site Content, StockCharts.com
KEY TAKEAWAYS
* The SPDR S&P 500 ETF (SPY) dipped lower after hitting resistance of its 50-day moving average
* There are three key turnaround levels to watch closely to determine if the pullback is over
* Breadth indicators can identify when the buyers are back
What's a trader...
READ MORE
MEMBERS ONLY
Stocks Plunge with Key Earnings on Tap
by David Keller,
President and Chief Strategist, Sierra Alpha Research
In this edition of StockCharts TV'sThe Final Bar, Dave welcomes Gina Martin Adams, CMT CFA of Bloomberg Intelligence. David highlights a spike higher in the VIX, and charts names for earnings including AMZN, AMD, SMCI, SBUX, MCD, PYPL, and ETN. Gina shows how rising interest rates continue to...
READ MORE
MEMBERS ONLY
DP Trading Room: Intermediate-Term View of the Magnificent 7

by Erin Swenlin,
Vice President, DecisionPoint.com
Today Carl puts the spotlight on the Magnificent 7 with a look at not only the daily charts, but also a review of the intermediate term using weekly charts. See where they are headed short-term and what are our expectations are in the intermediate term.
Carl also gave us his...
READ MORE
MEMBERS ONLY
S&P 500 Makes a New All-Time High By End of June?
by David Keller,
President and Chief Strategist, Sierra Alpha Research
We've been covering the signs of weakness for stocks, from the bearish divergences in March, to the mega-cap growth stocksbreaking through their 50-day moving averages, to even thedramatic increase in volatilityoften associated with major market tops. While Q1 was marked by broad market strength and plenty of new...
READ MORE
MEMBERS ONLY
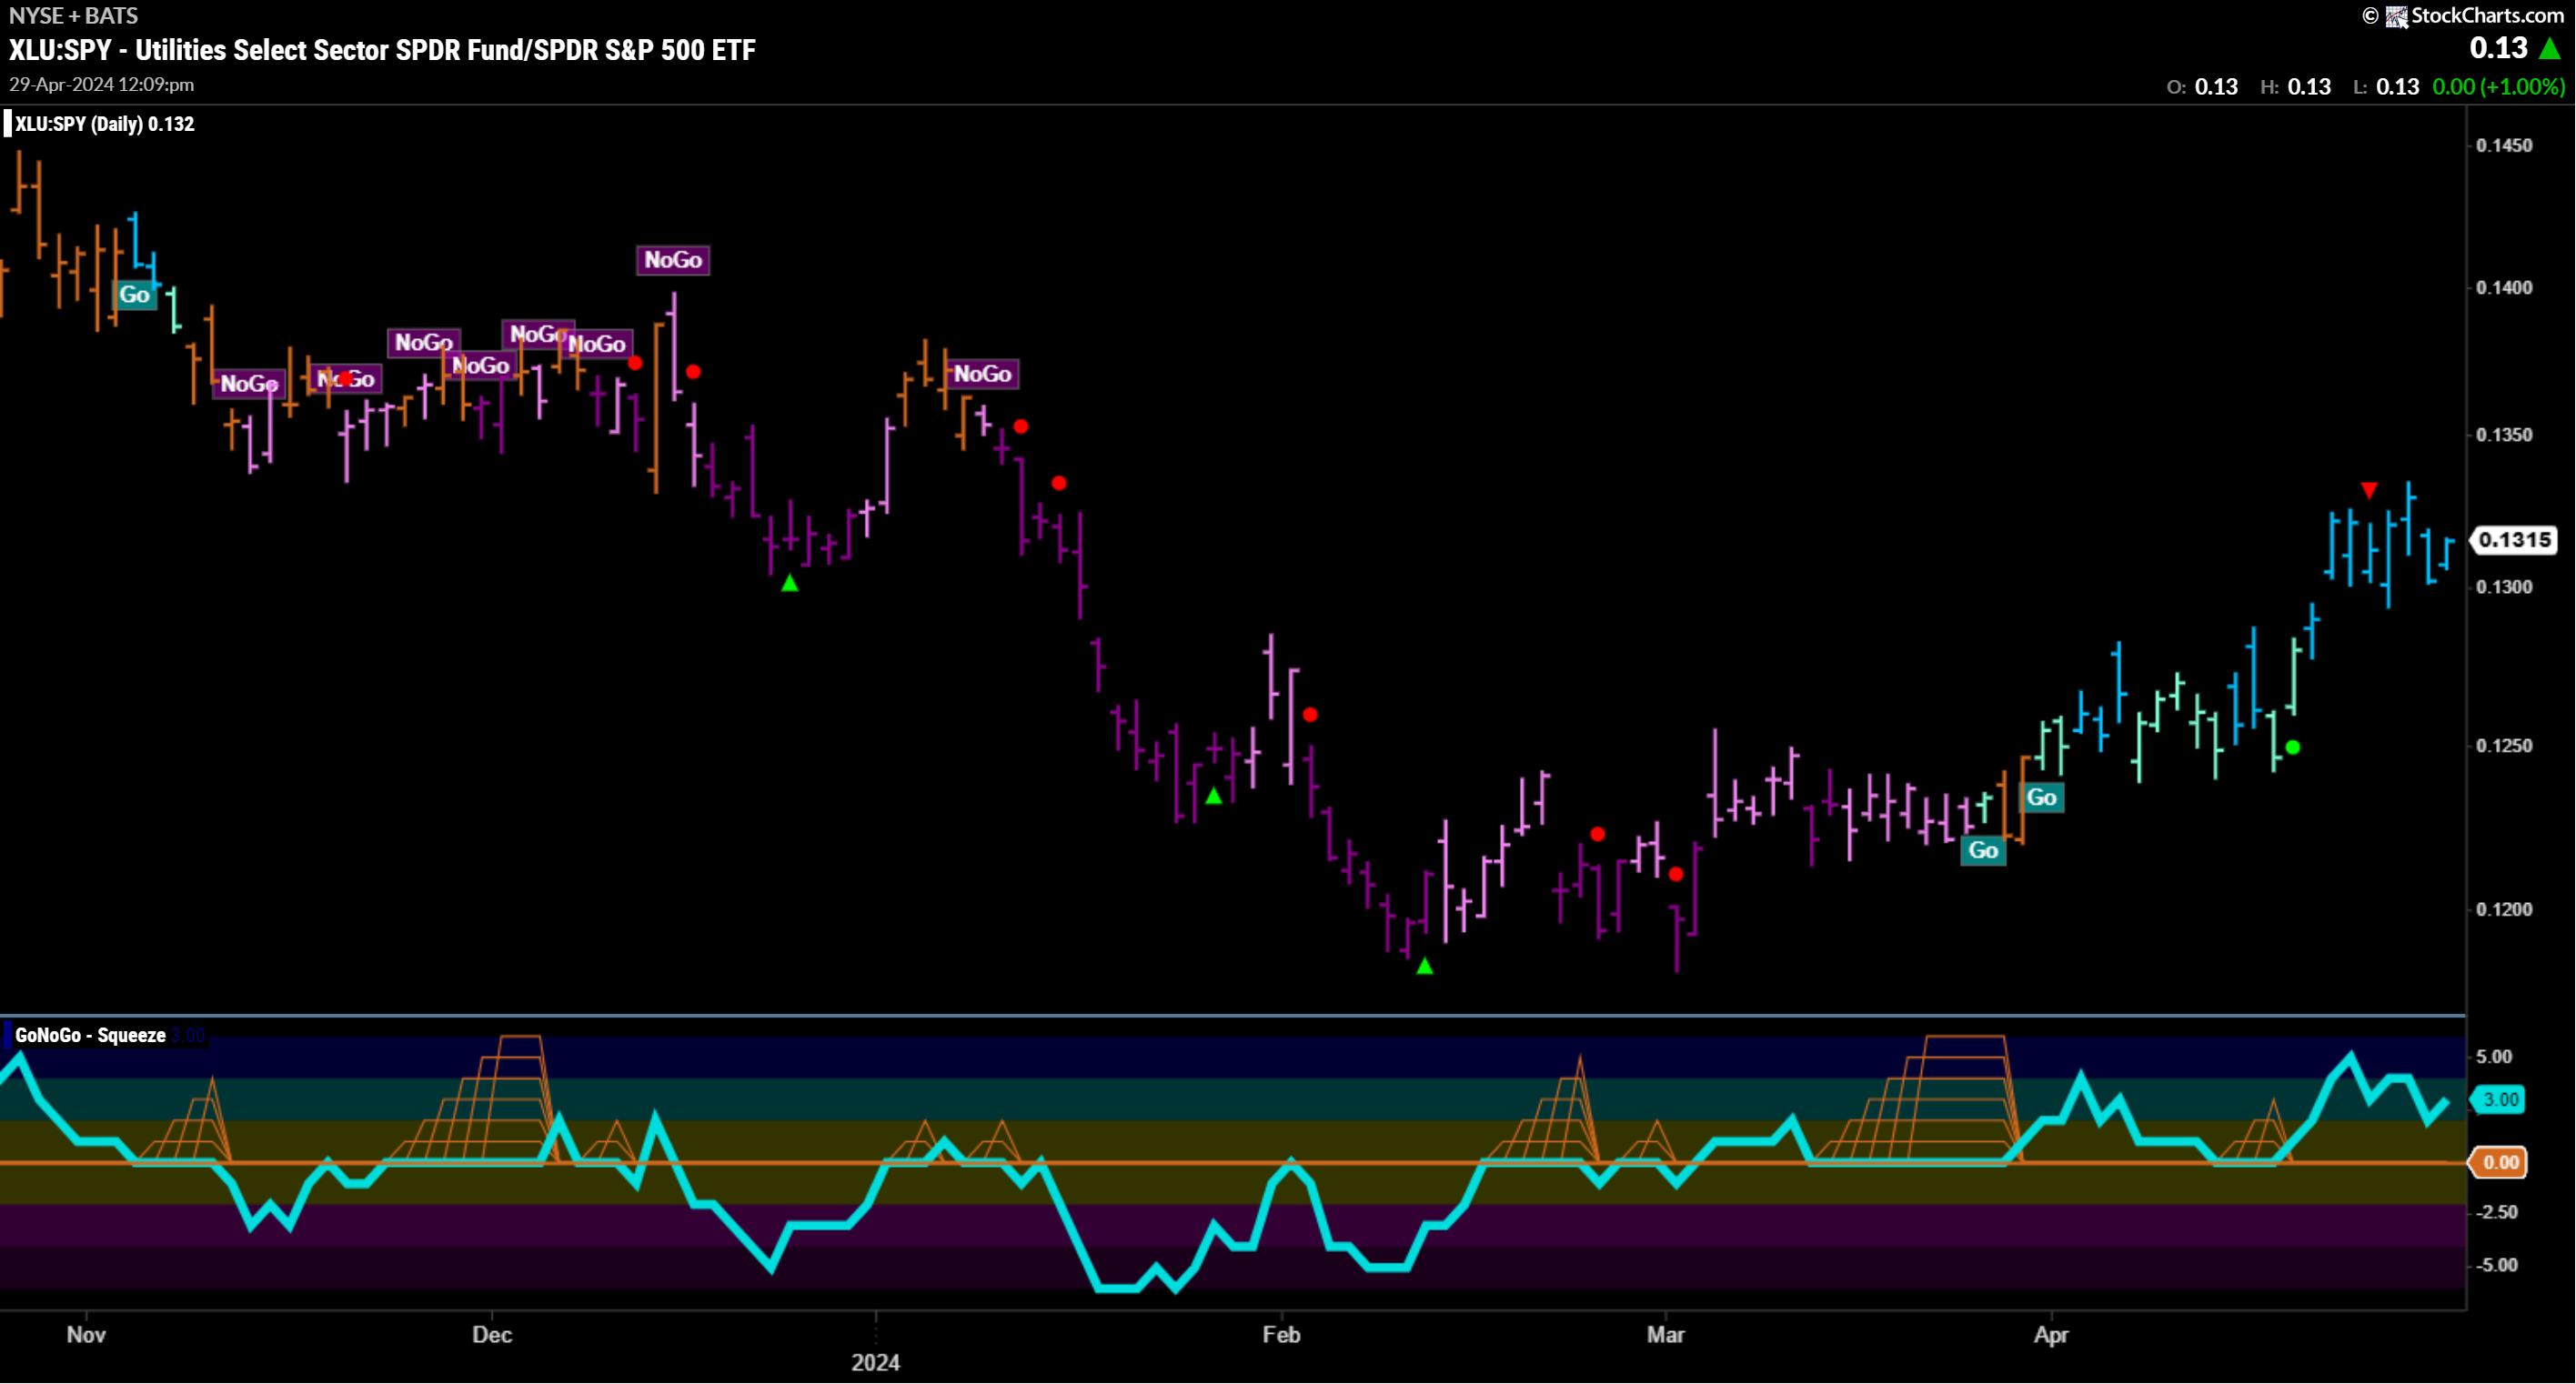
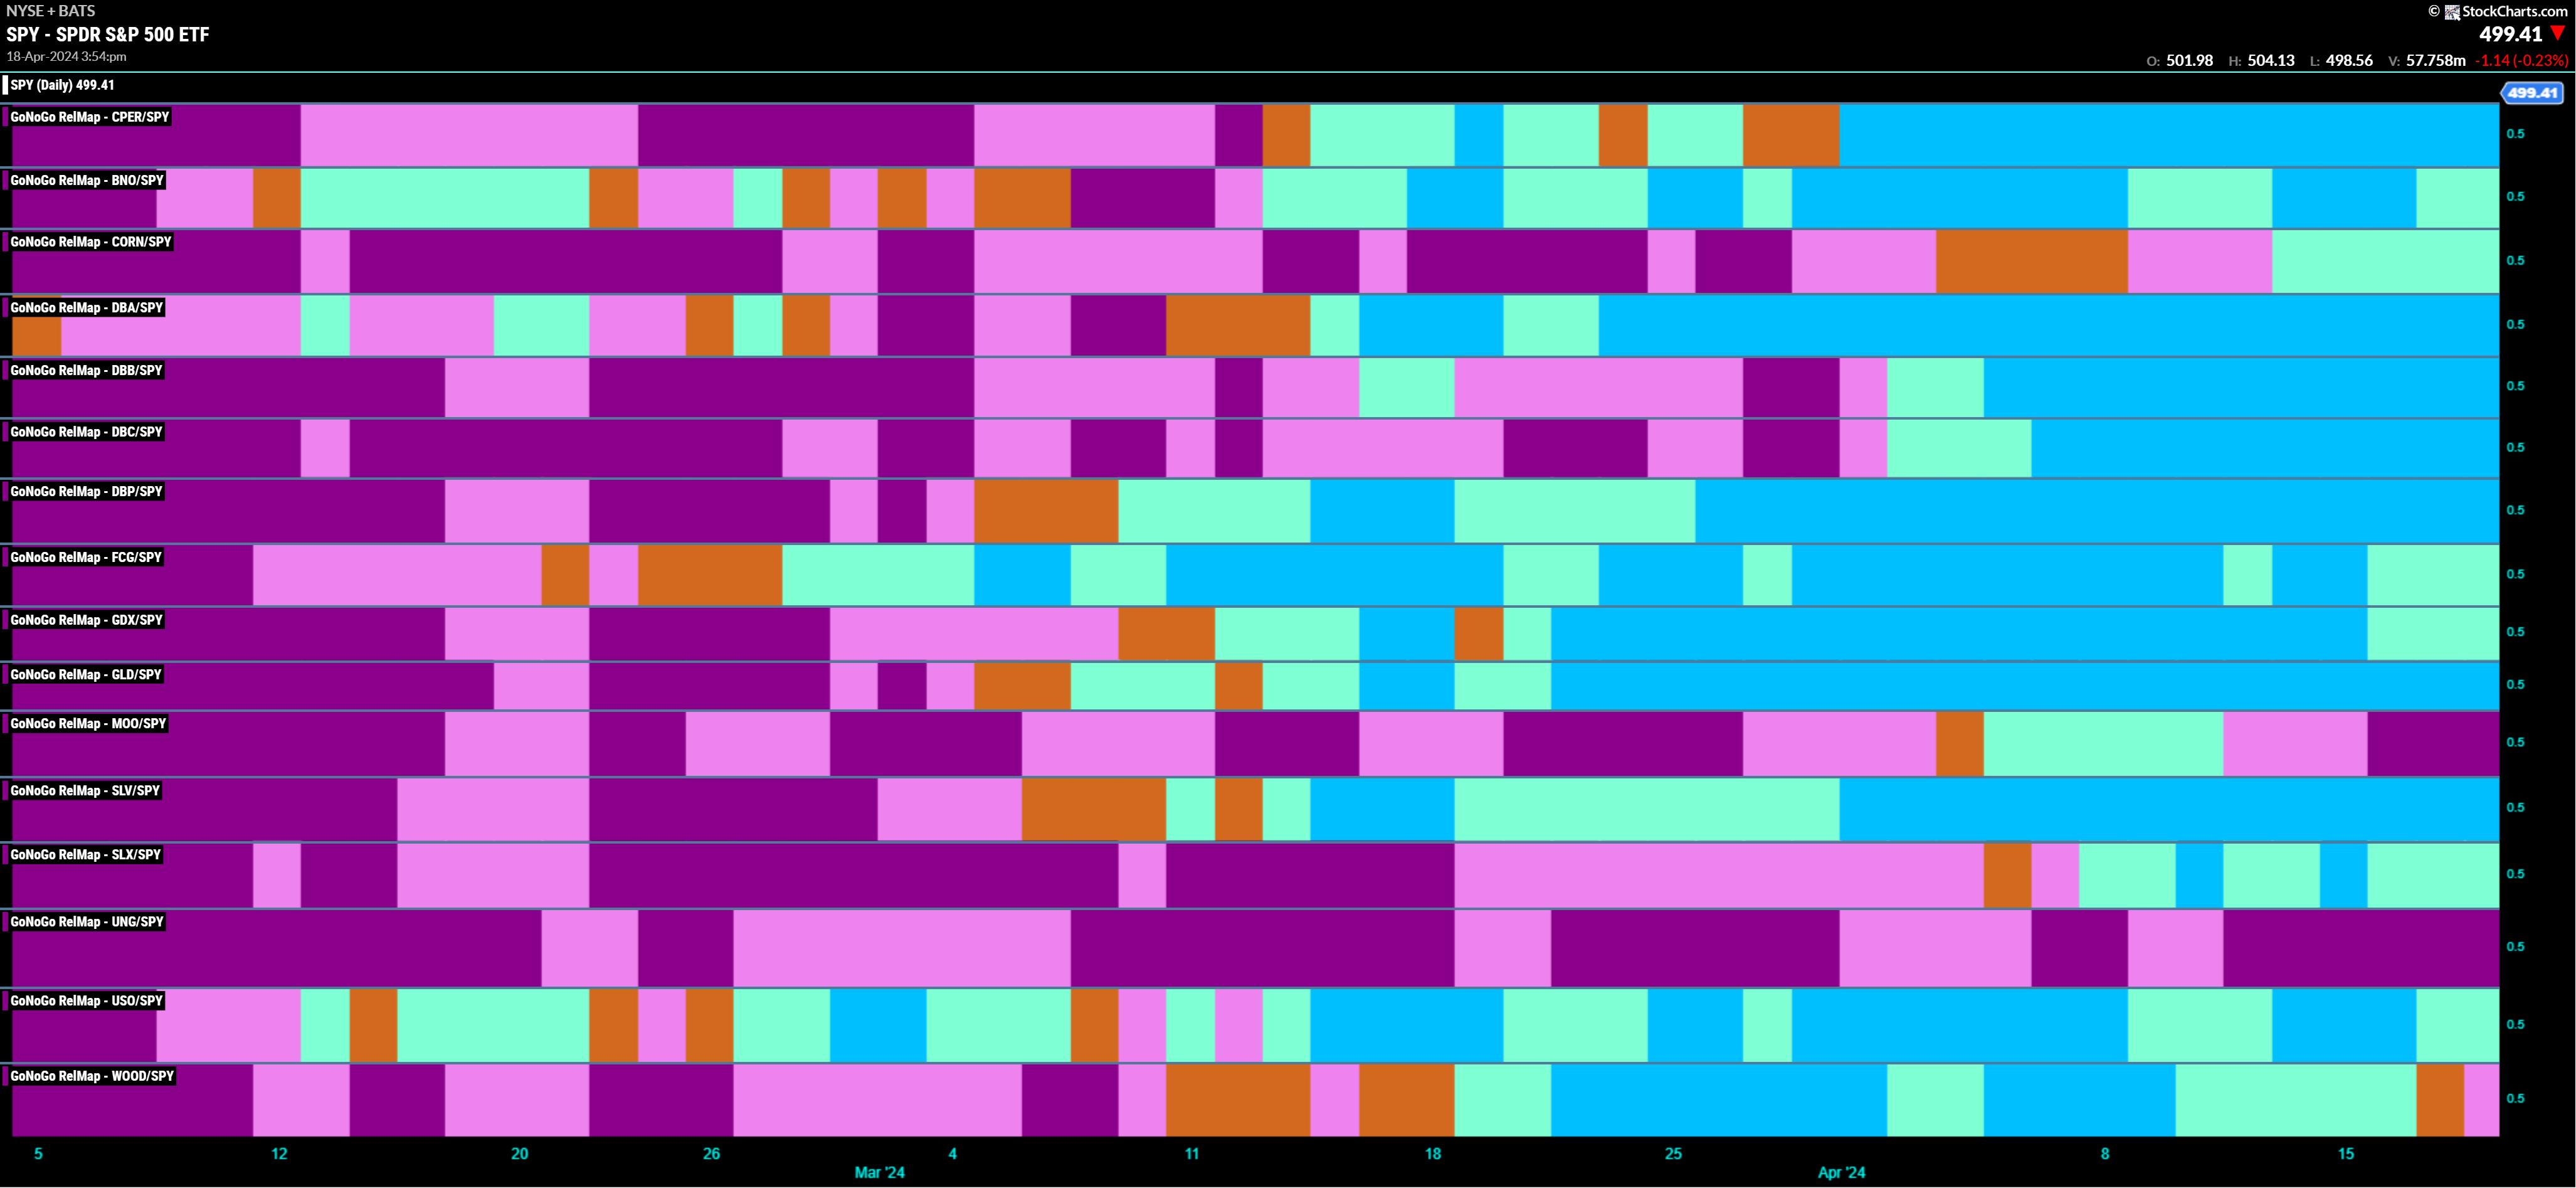
DEFENSE IS ON THE FIELD | GoNoGo Show APRIL 26, 2024

by Tyler Wood,
Co-founder, GoNoGo Charts®
KEY TAKEAWAYS
* Defensive Sector Leadership
* Risk Off Macro Environment
* Opportunities in Electricity Utilities Companies
Chart Above (XLU:SPY) highlights trending relative strength of Utilities Sector. Watch Video below for details:
The S&P500 trend conditions have continued this week in "NoGo" conditions despite relief rallies. Alex Cole...
READ MORE
MEMBERS ONLY

S&P 500 & Nasdaq Composite Approach Critical Resistance; Watch for These Important Levels!
by Jayanthi Gopalakrishnan,
Director of Site Content, StockCharts.com
KEY TAKEAWAYS
* The Nasdaq Composite is trading above its last swing high, which could a the first sign of a reversal to the upside
* The S&P 500 is up against resistance from its 50-day moving average and a downward sloping trendline
* The Dow Jones Industrial Average has reversed...
READ MORE
MEMBERS ONLY

Analyzing Alphabet's Surge — Here's How to Get In Earlier Next Time
by Karl Montevirgen,
The StockCharts Insider
KEY TAKEAWAYS
* Alphabet shocked Wall Street on Thursday when it reported earnings, its first dividend, and a $70-billion buyback
* The stock gapped up 16%, its biggest since 2015
* Alphabet's technical "undervaluation" and quirks signaled the go-ahead to go long
Using technical indicators to identify stocks fundamentally...
READ MORE
MEMBERS ONLY
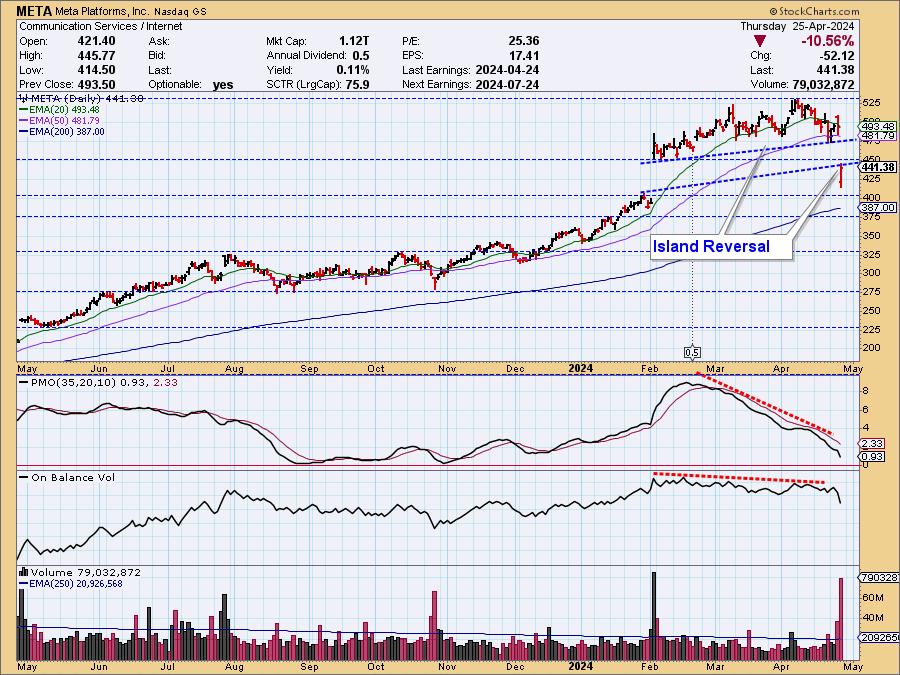
META's Reverse Island - Two More Mag Seven Islands to Monitor

by Carl Swenlin,
President and Founder, DecisionPoint.com
by Erin Swenlin,
Vice President, DecisionPoint.com
Whenever we see price gapping up or down, as happened with META in February, we prepare for the possibility of an island reversal. After the gap up, price forms a cluster, the island, and we ponder the possibility of a gap down to complete the reversal. During the formation of...
READ MORE
MEMBERS ONLY

Analyzing the SPY: How to Know When the Pullback is Over
by Jayanthi Gopalakrishnan,
Director of Site Content, StockCharts.com
KEY TAKEAWAYS
* SPY is trading within a downward channel in the daily chart and has equal odds of breaking out in either direction
* The weekly chart shows the uptrend is still in play and SPY is going through a healthy correction
* Analyze different index and sector exchange-traded funds to identify...
READ MORE
MEMBERS ONLY

What's Really Driving Tesla's Surprising Stock Surge?
by Karl Montevirgen,
The StockCharts Insider
KEY TAKEAWAYS
* TSLA has been riding a long and volatile downtrend since 2021
* Tuesday's earnings were dismal, yet the stock jumped 16% after an announcement about near-term EV production
* The big question is if the gap up in TSLA's stock price has any substance or if...
READ MORE
MEMBERS ONLY
Buy the Dip or Sell the Rip?
by David Keller,
President and Chief Strategist, Sierra Alpha Research
In this edition of StockCharts TV'sThe Final Bar, Dave welcomes Bret Kenwell of eToro. Bret shares the levels he's watching for AAPL and AMD, speaks to this week's bounce higher, and points out why Energy still shows long-term strength. David breaks down earnings names...
READ MORE
MEMBERS ONLY
Weak Charts Keep Getting Weaker
by David Keller,
President and Chief Strategist, Sierra Alpha Research
In this edition of StockCharts TV'sThe Final Bar, Dave examines names making moves in the market like Tesla (TSLA), Verizon (VZ), and Nucor (NUE). Explore the world of equity benchmarks and learn how large caps, mid caps, and small caps can offer unique opportunities based on sector rotation...
READ MORE
MEMBERS ONLY
DP TRADING ROOM: Find Shorts Using the Diamond Dog Scan
by Erin Swenlin,
Vice President, DecisionPoint.com
Today Erin shared her Diamond Dog Scan that she uses to find shorting opportunities. She was able to uncover five possible shorts. She discusses each chart and let's you know what she looks for in a good short.
Carl did the market overview with special attention paid to...
READ MORE
MEMBERS ONLY

Getting Perspective and Dealing with Volatility

by Arthur Hill,
Chief Technical Strategist, TrendInvestorPro.com
KEY TAKEAWAYS
* Primary moves define the long-term trend
* Secondary moves are corrections within bigger uptrends
* Corrections provide opportunities to partake in the bigger uptrend
The S&P 500 is down 5.5% this month and volatility is rearing its ugly head. This is a good time to get some...
READ MORE
MEMBERS ONLY
MEM TV: Capitulation Signals for a Market BOTTOM
by Mary Ellen McGonagle,
President, MEM Investment Research
In this episode of StockCharts TV'sThe MEM Edge, Mary Ellen reviews the negative shift that's evolved over the past week in the market and highlights key signals of capitulation you should be watching for. She then shares the move into Value stocks she's seeing...
READ MORE
MEMBERS ONLY
How to Chart In Multiple Timeframes Like A PRO

by Grayson Roze,
Chief Strategist, StockCharts.com
On this week's edition of StockCharts TV'sStockCharts in Focus, Grayson shows you how to chart the same symbol in multiple timeframes with ease using ChartStyles and StyleButtons. Learn how to customize multiple charts with the periods and ranges that fit with your system and then set...
READ MORE
MEMBERS ONLY

S&P 500 Approaches 100-Day Moving Average: Is Now an Attractive Time to Buy Stocks?
by Jayanthi Gopalakrishnan,
Director of Site Content, StockCharts.com
KEY TAKEAWAYS
* The possibility of only one interest rate cut and escalation of geopolitical tensions increases uncertainty levels for investors
* The 100-day simple moving average could be the S&P 500's next support level
* Massive selloff in Tech stocks sends the Nasdaq Composite below its 100-day moving...
READ MORE
MEMBERS ONLY
Top 10 Stocks to Watch April 2024
by David Keller,
President and Chief Strategist, Sierra Alpha Research
by Grayson Roze,
Chief Strategist, StockCharts.com
In this edition of StockCharts TV'sThe Final Bar, Dave and Grayson run through top 10 charts to watch in April 2024! Together they cover breakout strategies, moving average techniques, relative strength, and much more. You don't want to miss these insights into market dynamics and chart...
READ MORE
MEMBERS ONLY

META Stock in Limbo: What You Need to Know Before the Next Big Price Swing
by Karl Montevirgen,
The StockCharts Insider
KEY TAKEAWAYS
* Meta's prospects look bullish mostly due to the rollout of Meta AI, which is expected to lead to substantial growth in ad revenue
* While analyst price predictions show a wide range, consensus ratings lean towards a "Buy" to a "Strong Buy"
* Technically,...
READ MORE
MEMBERS ONLY
Rocks over Stocks | GoNoGo Show 041824
by Tyler Wood,
Co-founder, GoNoGo Charts®
KEY TAKEAWAYS
* New Risk Off Environment for Equities
* Commodities Leading
The S&P500 trend conditions have reversed into "NoGo" and strengthened to purple bars. Alex Cole and Tyler Wood, CMT identify intermarket forces including rising rates ($TNX) and a strong US Dollar (UUP) that can provide headwinds...
READ MORE
MEMBERS ONLY

Larry's "Family Gathering" April 18, 2024 Recording
by Larry Williams,
Veteran Investor and Author
Right now, there's lots of room for a downside in the market. Do we really want a rate cut?
In this video, Larry talks about past interest rate cuts from the Fed, and what happens to stock prices as a result. Historically, we've seen these cuts...
READ MORE
MEMBERS ONLY
Intraday Trading Entry and Exit Strategies
by Joe Rabil,
President, Rabil Stock Research
On this week's edition of Stock Talk with Joe Rabil, Joe details a trade setup in the QQQ that demonstrates how he uses MACD and ADX in multiple timeframes for his trading. He gives detail on the entry and exit for this trade. Joe then covers the stock...
READ MORE
MEMBERS ONLY

"Family Gathering" Meeting Today at 2:00 PM Eastern
Today, Larry Williams will be hosting a "Family Gathering" meeting at 2pm Eastern Daylight Time (11am Pacific). Sign-in in begins 5 minutes prior. The show will be recorded and posted online for those of you who cannot attend. Use the link below to join:
Link to Join Webinar:...
READ MORE
MEMBERS ONLY
Semiconductors are at CRITICAL Level!
by David Keller,
President and Chief Strategist, Sierra Alpha Research
In this edition of StockCharts TV'sThe Final Bar, Dave welcomes guest Danielle Shay of Simpler Trading. Danielle speaks to the downside rotation for the QQQ, SMH, and leading growth stocks, including why the $210 level is so crucial for the SMH. Dave highlights the recent downswing for Bitcoin,...
READ MORE
MEMBERS ONLY

Larry's LIVE "Family Gathering" Webinar Airs TOMORROW - Thursday, April 18 at 2:00pm EDT!
Larry is going LIVE! Don't miss the upcoming "Family Gathering" webinar with Larry Williams, airing live through Zoom on Thursday, April 18 at 2:00pm Eastern Daylight Time.
In this must-see event, Larry will be presenting his current opinions on a broad variety of current market...
READ MORE
MEMBERS ONLY

AMD Plunges to a Critical Support Level: Is Now the Time to Go Long?
by Karl Montevirgen,
The StockCharts Insider
KEY TAKEAWAYS
* AMD is in a technical (near-term) downtrend, but its fundamentals promise otherwise
* AMD's stock price is trailing NVDA, though its lead over the rest of the industry appears to be waning
* AMD is in a technical "buy" range and the potential for a bullish...
READ MORE
MEMBERS ONLY
Is Market Breadth Signaling THE TOP?!
by David Keller,
President and Chief Strategist, Sierra Alpha Research
In this edition of StockCharts TV'sThe Final Bar, Dave shows how bearish short-term breadth combined with the deterioration in long-term breadth lines up well with previous market tops. He then breaks down key levels for the S&P 500 index as well as MSFT, TSLA, and more....
READ MORE
MEMBERS ONLY

DP Trading Room: Final Earnings are In for 2023 Q4!
by Erin Swenlin,
Vice President, DecisionPoint.com
Carl opens the show with a view of the final earnings results for 2023 Q4! His chart reveals whether stocks are fair valued, overvalued or undervalued. Get his take on the current readings.
Carl gave us his market overview including Bitcoin, Gold Miners, Gold and Crude Oil and many more....
READ MORE
MEMBERS ONLY

Stay Ahead of the Markets with AUTOMATED Portfolio Reports
by Grayson Roze,
Chief Strategist, StockCharts.com
Staying on top of your portfolio in a fast-moving market can be a challenge. On this week's edition of StockCharts TV'sStockCharts in Focus, Grayson shows you how to make things easier on yourself with automated ChartList Reports for your portfolio. You'll learn how to...
READ MORE
MEMBERS ONLY

The Day the Yields Broke Out
by Martin Pring,
President, Pring Research
Wednesday brought an unexpected firming up of the inflation figures, causing analysts and commentators to trim the number of times they expect interest rates to be cut this year. Whenever it is that the questions turn away from whether to when and by how much, as was the case until...
READ MORE
MEMBERS ONLY

From Relic To Reckoning: Can Gold Surge To $3,000?
by Karl Montevirgen,
The StockCharts Insider
KEY TAKEAWAYS
* Gold is at record highs with retail investors buying despite sky-high valuations
* Fiscal, monetary, and geopolitical uncertainties are driving this "relic" turned "alternative currency"
* The technical context reveals a few strategic insights for anyone bullish on the yellow metal
The strange thing about gold...
READ MORE
MEMBERS ONLY

NVDA is Holding Strong: It's Time to Think About Accumulating this Stock
by Jayanthi Gopalakrishnan,
Director of Site Content, StockCharts.com
KEY TAKEAWAYS
* NVDA stock is rising as the broader market sells off
* NVDA is technically and fundamentally strong and is outperforming the S&P 500
* NVDA's stock price has broken above a downward channel, which could be the start of the next uptrend
Sometimes, it helps to...
READ MORE
MEMBERS ONLY
Master Market Entry with This RSI Strategy!
by Joe Rabil,
President, Rabil Stock Research
On this week's edition of Stock Talk with Joe Rabil, Joe explains how to use the RSI along with the MACD and ADX indicators. RSI is used as a timing tool when things are lined up. Joe goes through some of the key elements he looks for when...
READ MORE