MEMBERS ONLY

Is FedEx's Long-Term Uptrend in Jeopardy? Here's What to Watch.

by Karl Montevirgen,
The StockCharts Insider
KEY TAKEAWAYS
* A drop in global demand contributed to FedEx's quarterly earnings miss which caused the stock price to fall
* FedEx's stock price action reveals the critical price levels to watch for entry points
* Set technical price alerts at key support and resistance levels to closely...
READ MORE
MEMBERS ONLY

More from Mish's Outlook 2024 -- 17 Predictions
One area I cover in the Outlook 2024 is the teachings of Raymond Lo and how he sees the upcoming Year of the Dragon. Part of my comments on his analysis is based on this statement by Lo:
"Many has the misunderstanding that the Dragon is glamorous auspicious animal...
READ MORE
MEMBERS ONLY

Boost Your Trading Success with This Chart Trick

by Grayson Roze,
Chief Strategist, StockCharts.com
On this week's edition of StockCharts TV'sStockCharts in Focus, Grayson we reveals a useful chart trick that will revolutionize your trading toolkit. Get ready to dive into the site, explore the tools, and walk through the features that will help you maximize the value of your...
READ MORE
MEMBERS ONLY

Top Five Charts of 2023 #4: Leadership Themes

by David Keller,
President and Chief Strategist, Sierra Alpha Research
In the fourth of a five-part special series on StockCharts TV'sThe Final Bar, Dave discusses the top leadership trends of 2023. From the concept of narrow leadership to the rise of the Magnificent Seven, he explores the most important themes that shaped the year in this engaging episode....
READ MORE
MEMBERS ONLY

More from Mish's Outlook 2024 -- S&P 500
A passage from the Outlook:
SPY's all-time high was made in January 2022 at $479.98.
For now, the chart looks clear. If SPY pushes over 460, we can expect more upside at least until we get near the ATHs.
Should those levels clear, then we are in...
READ MORE
MEMBERS ONLY

Profit From the AI Wave Now: One Stock With Lots of Upside Potential

by Jayanthi Gopalakrishnan,
Director of Site Content, StockCharts.com
KEY TAKEAWAYS
* An earnings beat and strong guidance was enough to send shares of Micron Technology higher
* Micron Technology hit a new 52-week high and the stock has room for more upside
* Identify your entry and exit price targets to trade this stock
Yesterday's stock market selloff was...
READ MORE
MEMBERS ONLY

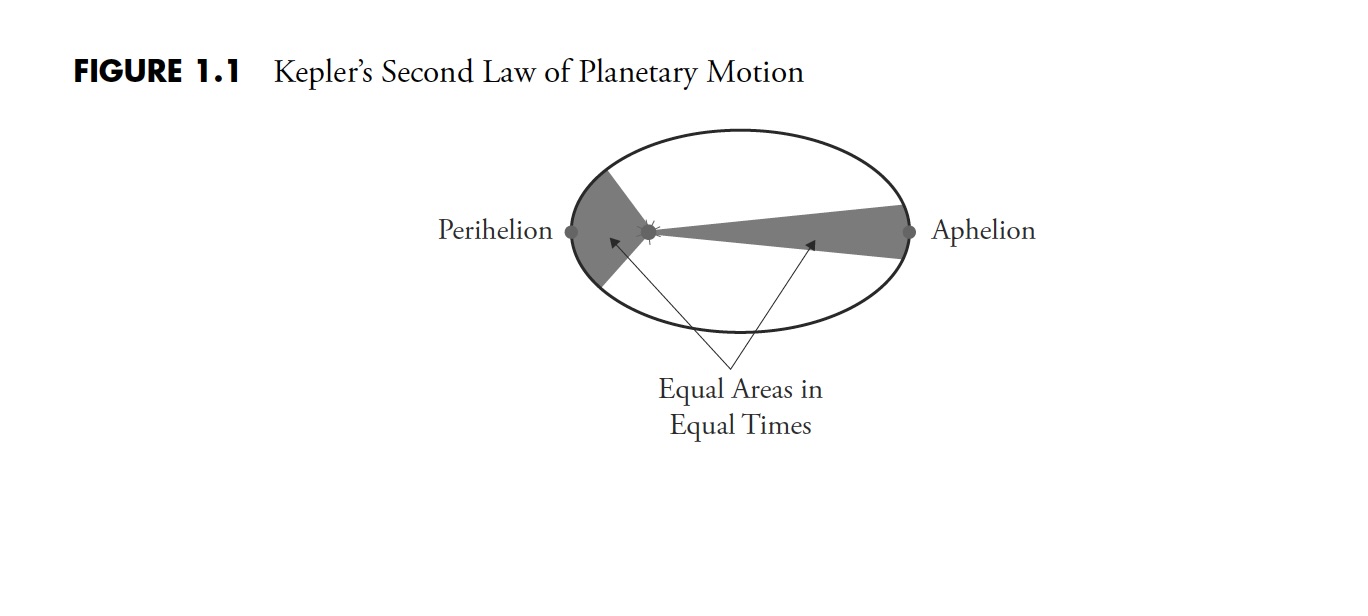
The Hoax of Modern Finance - Part 3: Fictions Told to Investors

by Greg Morris,
Veteran Technical Analyst, Investor, and Author
Note to the reader: This is the third in a series of articles I'm publishing here taken from my book, "Investing with the Trend," in article form here on my blog. Hopefully, you will find this content useful. Market myths are generally perpetuated by repetition, misleading...
READ MORE
MEMBERS ONLY

Mish's Outlook 2024 is Here -- Macro to Micro
Coming into 2023, we used the theme, "You can't hunt with the hounds and run with the rabbit." Those who stood back with the hounds, in search of a sure hit, were not only left behind, but missed the move higher as the rabbit got the...
READ MORE
MEMBERS ONLY

Costco's Record-Breaking Surge: Is It Time to Buy or Sell?
by Karl Montevirgen,
The StockCharts Insider
KEY TAKEAWAYS
* Costco experienced a significant rally driven by strong earnings and an upgraded analyst target of $700
* Despite COST's bullish prospects, the stock is overbought and is likely to pull back
* Setting price alerts at several support levels may be key to finding a strong long entry...
READ MORE
MEMBERS ONLY

Top Five Charts of 2023 #1: S&P 500
by David Keller,
President and Chief Strategist, Sierra Alpha Research
In the first of a five-part special series on StockCharts TV'sThe Final Bar, Dave walks through the S&P 500 index quarter by quarter. From the strong rally phase in the 2nd quarter to the dramatic reversal at the October low, 2023 has provided a perfect case...
READ MORE
MEMBERS ONLY

The 2 Best Holiday Gifts You Can Give Your Kids!

by Gatis Roze,
Author, "Tensile Trading"
Let's begin with the bottom line.
As parents, our reason for being here on planet Earth is to pass on to our children the life skills they'll need to succeed. Everyone talks about leaving a better planet for our children; why don't we try...
READ MORE
MEMBERS ONLY

Larry Williams' 2024 Market Outlook

by Larry Williams,
Veteran Investor and Author
by David Keller,
President and Chief Strategist, Sierra Alpha Research
On this edition of StockCharts TV'sThe Final Bar, legendary trader and author Larry Williams joins Dave to share his lessons learned in 2023, his outlook for stocks in 2024, and which cycles he feels all investors should be following into the new year.
This video originally premiered on...
READ MORE
MEMBERS ONLY

Are We Seeing 2020 All Over Again!?

by TG Watkins,
Director of Stocks, Simpler Trading
The market exploded higher after already being on a winning streak for 5 weeks. While there are blow-off top vibes, there could be a lot of money able to come in from the sidelines to keep the market going. In this week's edition of Moxie Indicator Minutes, TG...
READ MORE
MEMBERS ONLY

Momentum Madness and Nasdaq 100 Stocks

by Arthur Hill,
Chief Technical Strategist, TrendInvestorPro.com
Stocks went on a tear the last seven weeks with Nasdaq 100 stocks leading the charge. The S&P MidCap 400 SPDR (MDY) and Russell 2000 ETF (IWM) gained more than QQQ over the last seven weeks, but QQQ is still the only major index ETF to exceed its...
READ MORE
MEMBERS ONLY

Small-Caps Rocket to the Upside, Leave Large-Caps in the Dust
by David Keller,
President and Chief Strategist, Sierra Alpha Research
On this edition of StockCharts TV'sThe Final Bar,Julius de Kempenaer of RRG Research points out that growth vs. value is now more of a small vs. large question, with small caps rocketing to the upside in December. Host David Keller, CMT recaps the top charts of the...
READ MORE
MEMBERS ONLY

The Hoax of Modern Finance - Part 2: Indicators, Terminology, and Noise
by Greg Morris,
Veteran Technical Analyst, Investor, and Author
Note to the reader: Over the next couple of weeks and months, I will be republishing the contents of my book, "Investing with the Trend," in article form here on my blog. I'm calling this series "The Hoax of Modern Finance" for reasons you...
READ MORE
MEMBERS ONLY

Find Aggressive Entry Opportunities & Tradeable Trends with Multi-Timeframe Charts

by Joe Rabil,
President, Rabil Stock Research
On this week's edition of Stock Talk with Joe Rabil, Joe explains how to use multiple timeframes to help when getting an aggressive entry in a stock. He starts by explaining the tradable trend, then shows how an aggressive opportunity develops. To close out the show, he analyzes...
READ MORE
MEMBERS ONLY
Larry's "Family Gathering" December 14, 2023 Recording
by Larry Williams,
Veteran Investor and Author
In this video, Larry presents his forecast for FANG stocks, including an analysis of the stock selloff for META. He then digs into the cycle of debt and why he's bothered about credit card writeoffs. After that, he examines the weekly economic index and GDP and how they...
READ MORE
MEMBERS ONLY
"Family Gathering" Meeting Today at 2:00 PM Eastern
Today, Larry Williams will be hosting a "Family Gathering" meeting at 2pm Eastern Standard Time (11am Pacific). Sign-in in begins 5 minutes prior. The show will be recorded and posted online for those of you who cannot attend. Use the link below to join:
Link to Join Webinar:...
READ MORE
MEMBERS ONLY
The Hoax of Modern Finance - Part 1: Introduction
by Greg Morris,
Veteran Technical Analyst, Investor, and Author
Note to the reader: Over the next couple of weeks and months, I will be republishing the contents of my book, "Investing with the Trend," in article form here on my blog. I'm calling this series "The Hoax of Modern Finance" for reasons you...
READ MORE
MEMBERS ONLY

Larry's Final LIVE "Family Gathering" Webinar of 2023 Airs THIS WEEK - Thursday, December 14th at 2:00pm EST!
Larry is going LIVE! Don't miss the upcoming "Family Gathering" webinar with Larry Williams, airing live through Zoom this Thursday, December 14 at 2:00pm Eastern Standard Time.
In this must-see event, Larry will be presenting his current opinions on a broad variety of current market...
READ MORE
MEMBERS ONLY

Week Ahead: NIFTY Faces An Imminent Consolidation; This Index May Finally Start To Relatively Outperform

by Milan Vaishnav,
Founder and Technical Analyst, EquityResearch.asia and ChartWizard.ae
The markets continued their unabated upmove; following a strongly trending week, the Nifty not only ended at a fresh lifetime high point but also closed with gains for the sixth consecutive week. The markets piled up decent returns despite some signs of consolidation in the second half of the week....
READ MORE
MEMBERS ONLY

This Li'l Checkbox is KEY When Comparing Stocks & Charting Multiple Timeframes
by Grayson Roze,
Chief Strategist, StockCharts.com
On this week's edition of StockCharts TV'sStockCharts in Focus, Grayson shares the secret to comparing symbols and making multi-timeframe analysis a breeze! Using the "Load Symbol Only" checkbox, he demonstrates how to review a list of symbols with different chart templates, all without having...
READ MORE
MEMBERS ONLY

Top 10 Charts to Watch in December 2023
by David Keller,
President and Chief Strategist, Sierra Alpha Research
by Grayson Roze,
Chief Strategist, StockCharts.com
In this edition of StockCharts TV'sThe Final Bar, Dave is joined by StockCharts' own Grayson Roze as they break down the trends for the top ten stocks and ETF charts for December 2023. Together, they identify key levels and signals to watch for using technical analysis tools...
READ MORE
MEMBERS ONLY

Useful Directional Indicator Criteria for Your Success as a Trader!
by Joe Rabil,
President, Rabil Stock Research
On this week's edition of Stock Talk with Joe Rabil, Joe shows the 2 criteria he is looking for in directional indicators to determine when the buyers or sellers are taking command. He explains how this signal can be used to your advantage in both analysis and trading....
READ MORE
MEMBERS ONLY

High Risk of Market Downside in December?
by David Keller,
President and Chief Strategist, Sierra Alpha Research
In this edition of StockCharts TV'sThe Final Bar, guest John Kosar, CMT of Asbury Research updates his Asbury Six tactical market model and shares how investors can be better positioned for market uncertainty into 2024. Host Dave highlights the strong rally in financials and airlines, and reveals one...
READ MORE
MEMBERS ONLY

Trend Channels Help Define Stock Pullback Scenarios
by David Keller,
President and Chief Strategist, Sierra Alpha Research
In this edition of StockCharts TV'sThe Final Bar, guest Sam Burns, CFA of Mill Street Research focuses on strength in financials, weakness in crude oil, and key macro themes he'll be tracking into 2024. Meanwhile, Dave tracks the relentless upswing for Bitcoin, the pullback in gold...
READ MORE
MEMBERS ONLY

Cryptocurrency Prices in the Spotlight, Small Caps Now in an Uptrend
by Jayanthi Gopalakrishnan,
Director of Site Content, StockCharts.com
KEY TAKEAWAYS
* Bitcoin closes above 42,000, a 20-month high
* Small caps also closed higher and are now in an uptrend
* Watch how seasonal patterns play out in December as it can be an indication of what to expect in 2024
The stock market seems to be pulling back after...
READ MORE
MEMBERS ONLY
DP Trading Room: How Bad Data From Major Indexes Leads to Bad Analysis

by Erin Swenlin,
Vice President, DecisionPoint.com

by Carl Swenlin,
President and Founder, DecisionPoint.com
In this week's edition of The DecisionPoint Trading Room, Carl discusses his recent epiphany regarding data derived from major indexes. Bad data will lead to bad analysis, so it's important to understand this concept for analyzing major indexes. He and Erin discuss the implications of Magnificent...
READ MORE
MEMBERS ONLY

Stock Market Starts December On A Strong Note: What This Means For the Rest of the Year
by Jayanthi Gopalakrishnan,
Director of Site Content, StockCharts.com
KEY TAKEAWAYS
* The S&P 500 index closed at its 2023 high
* The Dow Jones Industrial Average hits a new 52-week high
* The S&P 600 Small Cap Index led the rally with a 2.89% gain
The stock market is off to a great start on the...
READ MORE
MEMBERS ONLY
MEM TV: Nasdaq Flat But These Top Areas Outperform!

by Mary Ellen McGonagle,
President, MEM Investment Research
In this episode of StockCharts TV'sThe MEM Edge, Mary Ellen reviews the outperformance that took place amid a declining rate environment, while also highlighting price action in Tech, which trended sideways last week. She also reviews Dow stocks that just entered a new uptrend as the Index hits...
READ MORE
MEMBERS ONLY

Don't Even Think About Investing Without Addressing These 10 Essentials (Part 2: Essentials #6 - #10)
by Gatis Roze,
Author, "Tensile Trading"
I'm not an investment arsonist! I won't try to convince you that stock market perfection is achievable. I will, however, guarantee (strong word) that if you put in the effort, the results will be as Vince Lombardi often claimed: "Perfection is not attainable, but if...
READ MORE
MEMBERS ONLY

SNAP's Stock Price Snaps Out Above Bollinger Band -- Could This Be a Profitable Opportunity?
by Jayanthi Gopalakrishnan,
Director of Site Content, StockCharts.com
Snap Inc.'s stock (SNAP) price exceeded its upper Bollinger Band. But what does this mean for the stock's price move?
To start, a move above a Bollinger Band isn't necessarily a signal to buy. It's more of an indication of strength, and...
READ MORE
MEMBERS ONLY

Unlock the Secrets of Five Candlestick Patterns
by Joe Rabil,
President, Rabil Stock Research
On this week's edition of Stock Talk with Joe Rabil, Joe presents 5 specific candlestick patterns and how to use them. He explains how the location of these candles have an impact on their importance, and also discusses how a higher timeframe candle can help with trades on...
READ MORE
MEMBERS ONLY

Santa Comes to Wall Street | Focus on Stocks: December 2023
by Larry Williams,
Veteran Investor and Author
Santa Comes to Wall Street
Maybe St. Nick gets into the eggnog before he visits Wall Street each year, because the trading pattern has been a step up, then a stumble down before recovering at the end of the year. I first noticed this Up-Down-Up pattern back in the early...
READ MORE
MEMBERS ONLY
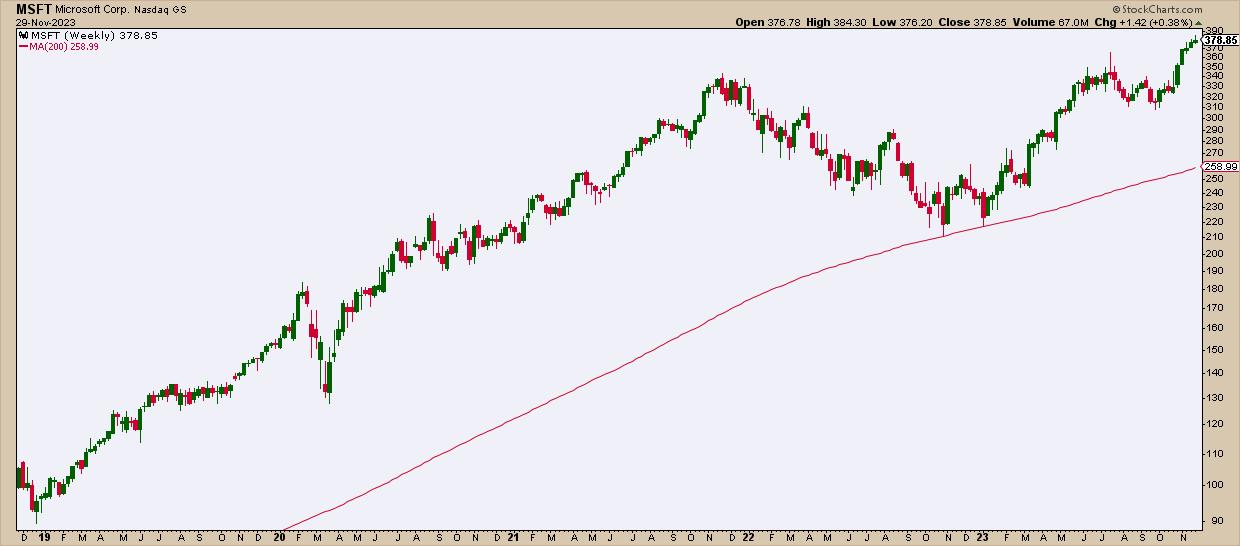
MSFT Stock At Record High: Is Now the Time to Buy Before It Skyrockets Further?
by Karl Montevirgen,
The StockCharts Insider
KEY TAKEAWAYS
* MSFT stock price surges past its 52-week high but. pulls back, closing just shy of $379
* Investors should watch for dips and resistance-turned-support levels for long entries
* Microsoft's massive investment in OpenAI could help push the stock price higher
While Microsoft's (MSFT) Azure contends...
READ MORE
MEMBERS ONLY

Follow This Powerful Seasonal Playbook in Election Years
by David Keller,
President and Chief Strategist, Sierra Alpha Research
In this edition of StockCharts TV'sThe Final Bar, guest Jeff Hirsch of theStock Trader's Almanacshares the suggested seasonal pattern for 2024 and breaks down how previous election years have played out. Host David Keller, CMT highlights a breakout in gold miners, regional banks breaking above their...
READ MORE
MEMBERS ONLY

The Final Episode: Jesse Livermore Insights and Holding 'Dead Money' Positions

by Dave Landry,
Founder, Sentive Trading, LLC
In the final edition of Trading Simplified, Dave shows his methodology in action by sharing two positions that he continues to hold, even though they were "dead money" most of the time, and why he applied discretion to stick with a losing position to possibly avoid a loss....
READ MORE
MEMBERS ONLY

Coinbase's Stock Price Could See a Sizable Move: Time to Seize the Opportunity?
by Jayanthi Gopalakrishnan,
Director of Site Content, StockCharts.com
KEY TAKEAWAYS
* Coinbase stock has broken above its trading range
* The stock ranked in top position in the SCTR ranking for large-cap stocks
* The stock may be overbought and due for a pullback
The cryptocurrency space has had its share of challenges, but Coinbase (COIN) looks like it may be...
READ MORE
MEMBERS ONLY

DP Trading Room: How To Time Your Trade Entries & Exits Like a Pro
by Erin Swenlin,
Vice President, DecisionPoint.com
In this week's edition of The DecisionPoint Trading Room, Erin flies solo today and gives everyone a refresher course on how to expertly time your entries and exits for trades, using the 5-minute candlestick chart. She covers the market in general, followed by analysis of sectors of interest...
READ MORE