Tech Stumbles, Market Widens: What Savvy Investors Should Watch Now

Key Takeaways
- XLK slipped below its 21-day EMA, and momentum is cooling.
- Small- and mid-caps, NYSE, and Dow Transports show upstreaks, and $SPXEW is gaining momentum.
It’s been a softer week for stocks so far, and the big tech names, which occupy a large slice of the S&P 500 ($SPX), are leading the pullback. On Monday, Meta Platforms, Inc. (META) slid a little over 2% and continued to sell off into Tuesday, dipping below its 21-day exponential moving average (EMA). On Tuesday, in the Market Movers panel on your dashboard, Palantir Technologies, Inc. (PLTR) topped the % Down list, with Advanced Micro Devices (AMD) and Super Micro Computer, Inc. (SMCI) also on the list.
Are tech stocks in trouble, or just taking a breather?
A Tech Check: XLK
Let’s take a look at the daily chart of the Technology Select Sector SPDR Fund (XLK). XLK closed below its 21-day EMA, its Relative Strength Index (RSI) is slipping (a sign of slowing momentum), and the Percentage Price Oscillator (PPO) also agrees that momentum is cooling.
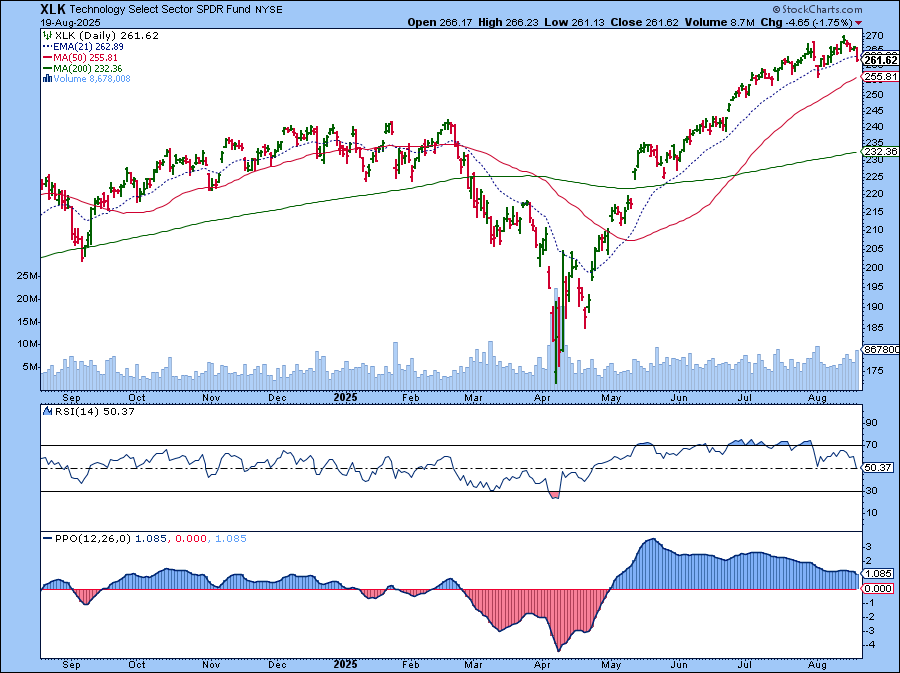
So, yes, tech stocks are selling off. The open question is whether this is a healthy, short-term reset or the start of something bigger.
While Tech Rests, Other Areas Wake Up
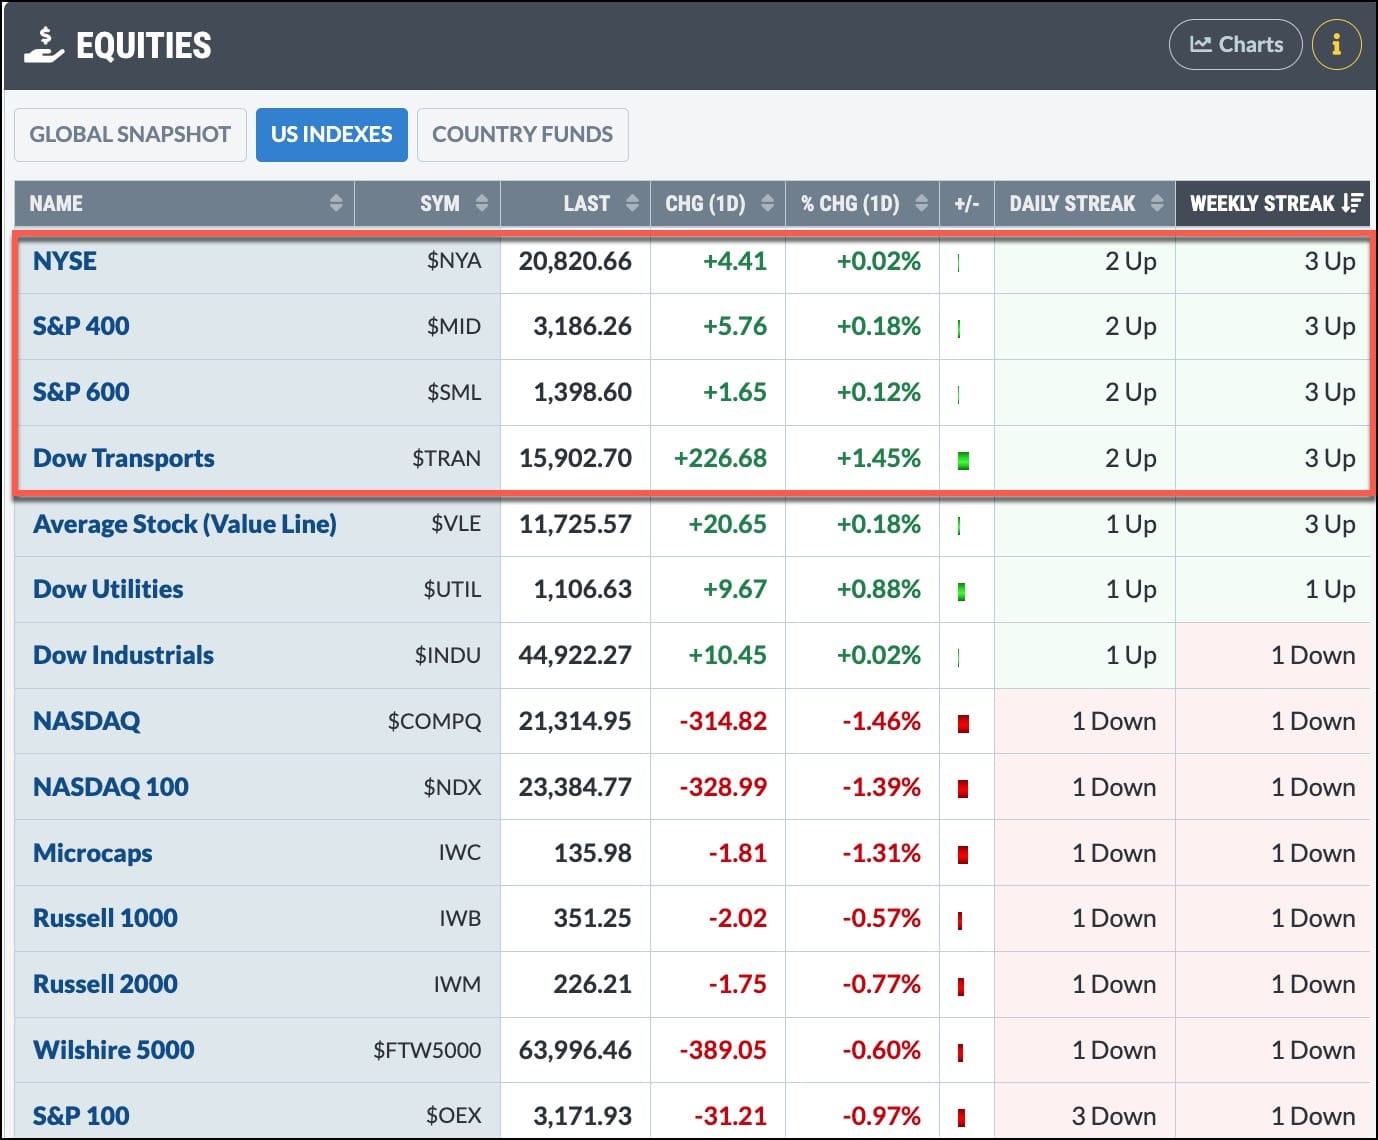
Outside of tech, there’s some encouraging action. Small- and mid-cap indexes have logged two straight up days and three up weeks, and we’re seeing similar strength in the NYSE and Dow Transports. This action hints at broader market participation.
You can confirm this on the Equities panel of the Market Summary page.
Cap-Weighted vs. Equal-Weighted
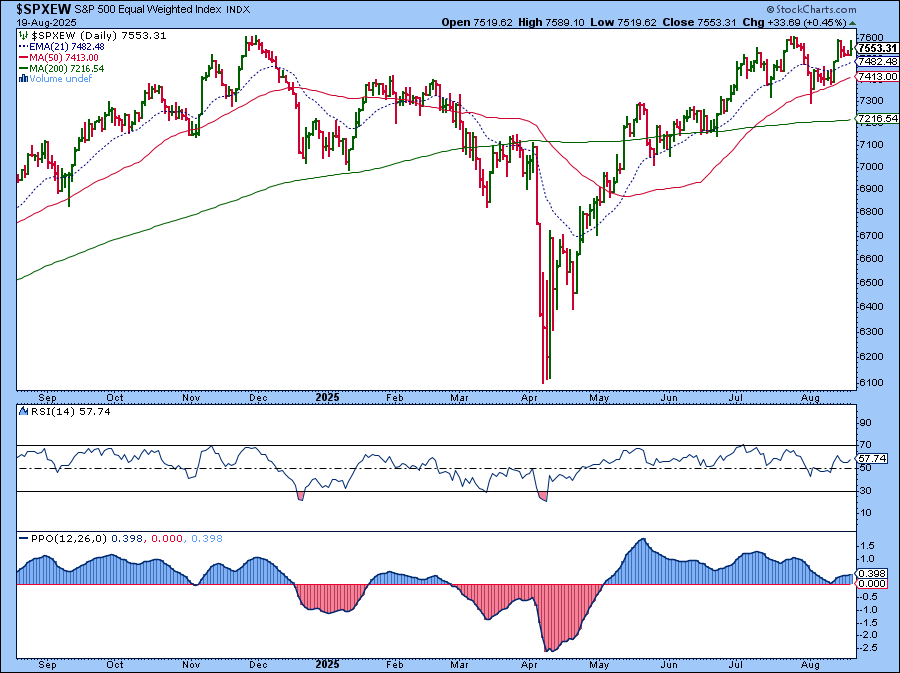
It’s worth comparing the S&P 500 Equal Weighted Index ($SPXEW) relative to the cap-weighted S&P 500 (see chart below).
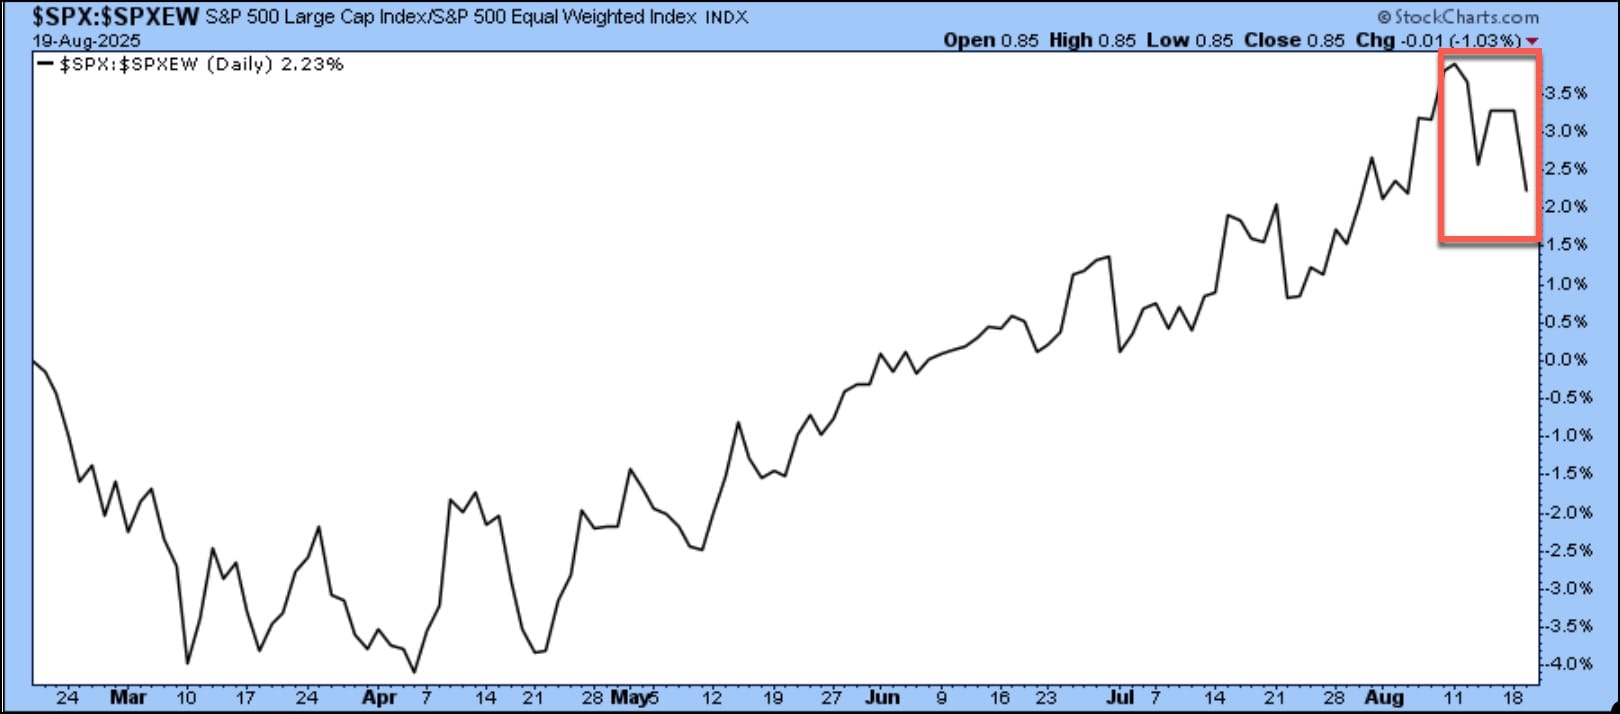
Since August 11, the S&P 500 has been losing its strength relative to its equal-weighted counterpart, and $SPXEW is gaining some momentum.
Does this mean we can expect to see investors rotating into other sectors of the market? Maybe. On the % Bullish Percent Indexes panel in the Market Summary page, the Nasdaq Composite ($COMPQ) and Nasdaq 100 ($NDX) are sitting at neutral readings, while the S&P 100 ($OEX), S&P 500, Dow Industrials ($INDU), and Dow Transports ($TRAN) are on the bullish side. Speaking of Industrials, the Dow Industrials notched a record high on Tuesday morning before easing back later in the day.
If you look at the Sector BPIs, it’s a mixed bag. Communication Services, Consumer Discretionary, Financials, Health Care, Industrials, and Utilities are bullish, whereas Consumer Staples, Energy, Technology, Materials, and Real Estate are neutral.
This week’s action suggests investors are, at least for now, rotating out of tech and into other sectors of the market. Whether it sticks is the big unknown.
What This Means For You
A steady routine can help you stay on track. Here are a few data points to monitor:
- Use the Market Summary page to watch sector performance and the % Bullish readings.
- Keep an eye on the $SPXEW vs. $SPX to see if equal weight is outperforming.
- For the various sectors and indexes, watch the price action around the 21-day EMA.
The Bottom Line
Yes, tech is under pressure, but other areas are stepping up. By checking the Market Summary page regularly, you can spot when investor preferences shift and be ready to take advantage of new buying opportunities when they arise.


