After the Stock Market Drop: Is This the Wake-Up Call?

Key Takeaways
- The stock market's sharp pullback and spike in VIX remind us to stay alert.
- Fewer stocks are holding above key moving averages, and investors are rotating from offensive to defensive stocks.
- Be prepared for the stock market to stay choppy as earnings and political headlines unfold.
Well, that was quite a week, wasn’t it? You’ve probably heard the old saying, “Markets take the stairs up and the elevator down.” That pretty much sums up what we witnessed.
In the midst of a U.S. government shutdown, the market was busy making its own headlines. AMD’s stock jumped after its deal with OpenAI, gold traded above $4,000, Tesla announced plans for a lower-priced car, and healthcare stocks got a nice boost. Then Friday hit, and with it, a new round of tariff talk. President Trump called for a “massive increase” in tariffs on Chinese imports, and that sent the major indexes sharply lower.
Here’s where things ended up:
- Dow Industrials ($INDU): 45,479.60 (-1.90%)
- S&P 500 ($SPX): 6,552.51 (-2.71%)
- Nasdaq Composite ($COMPQ): 22,204 (-3.56%)
If you glance at the daily price action of these indexes, it’s clear the bulls took a big breather. A quick look at the Equities panel of the Market Summary page shows that all the broader indexes, with the exception of Dow Utilities ($UTIL), are trading below their 20-day Exponential Moving Average (EMA). The six-month daily chart of the S&P 500 below pretty much sums it up.
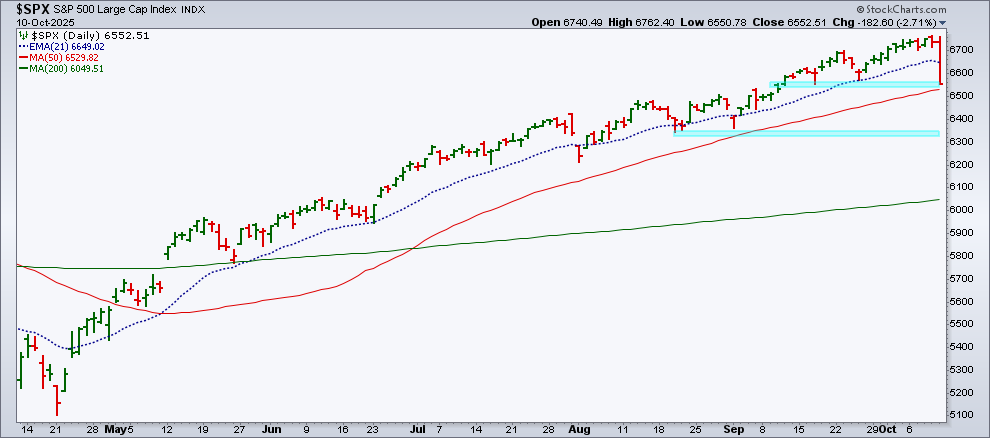
The index is approaching a support zone (marked in blue), which is around its 50-day Simple Moving Average (SMA). If it slips below that, the next support zone could come into play.
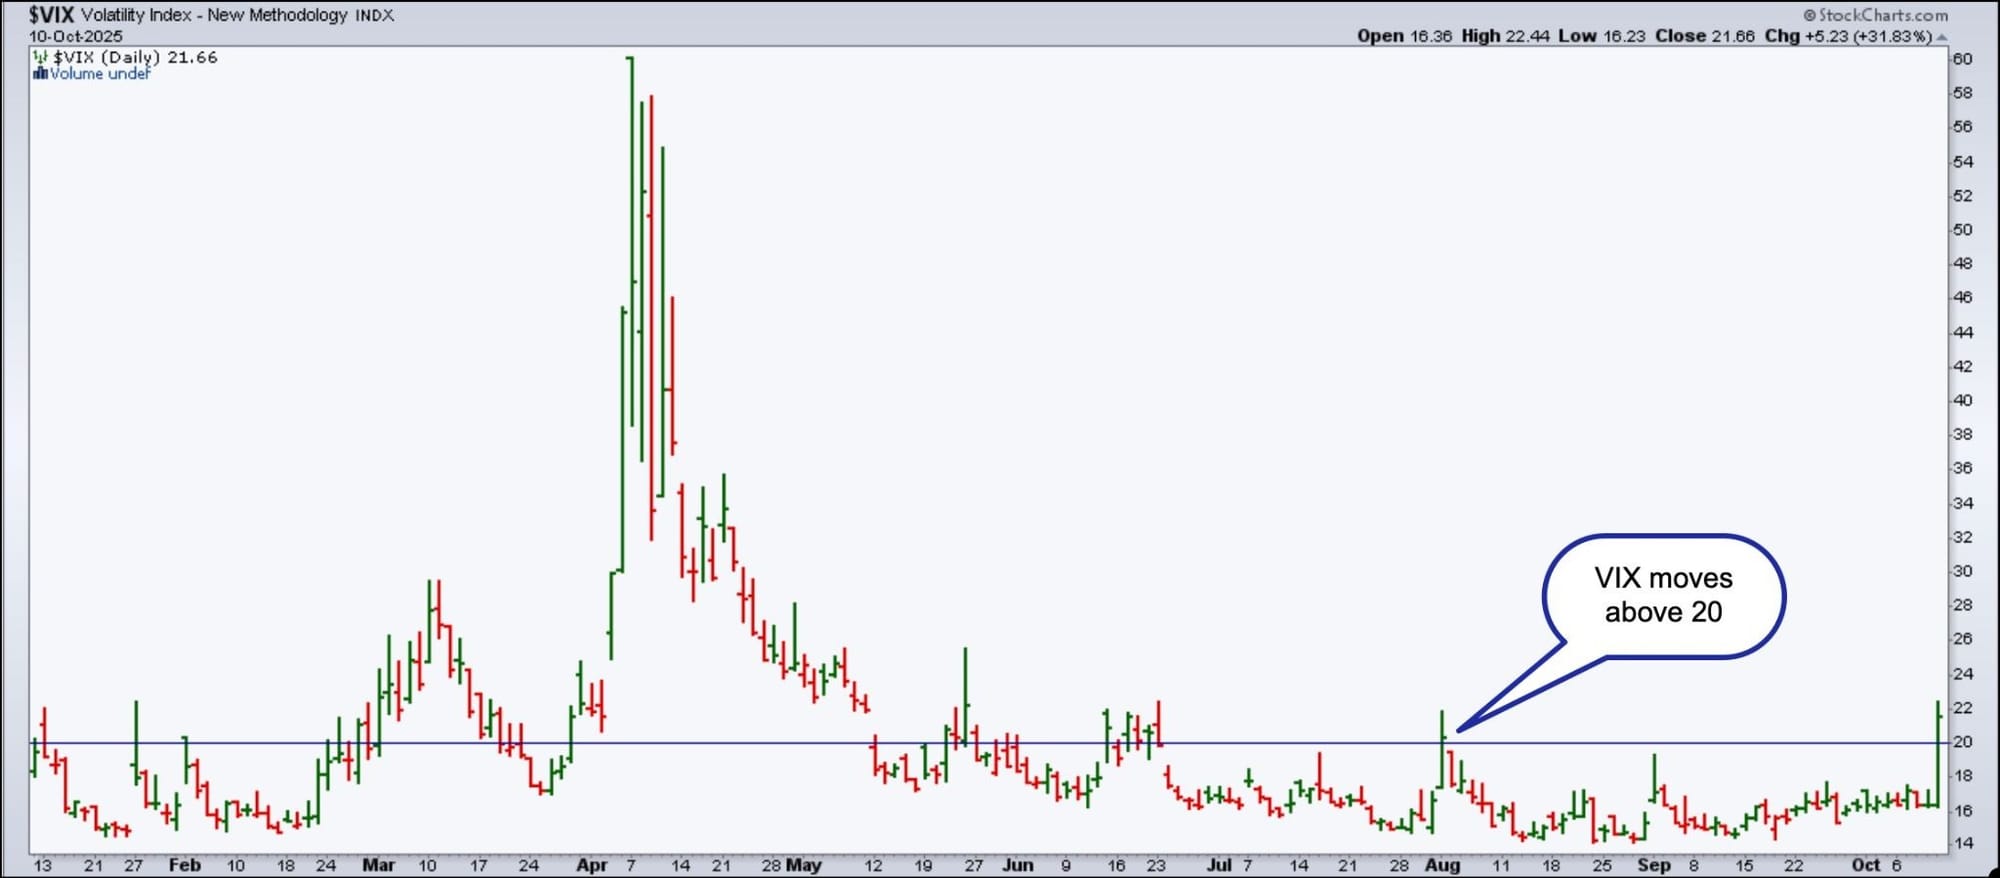
The Cboe Volatility Index ($VIX), which has been below 20 since August 1, spiked to 21.67. That’s a +30% jump in one day. The last time the VIX went above 20 was on August 1, the day the employment report showed a slowing labor market, and President Trump issued an executive order calling for higher tariffs. Looks like tariff worries haven’t gone away.
Market Breadth Weakness
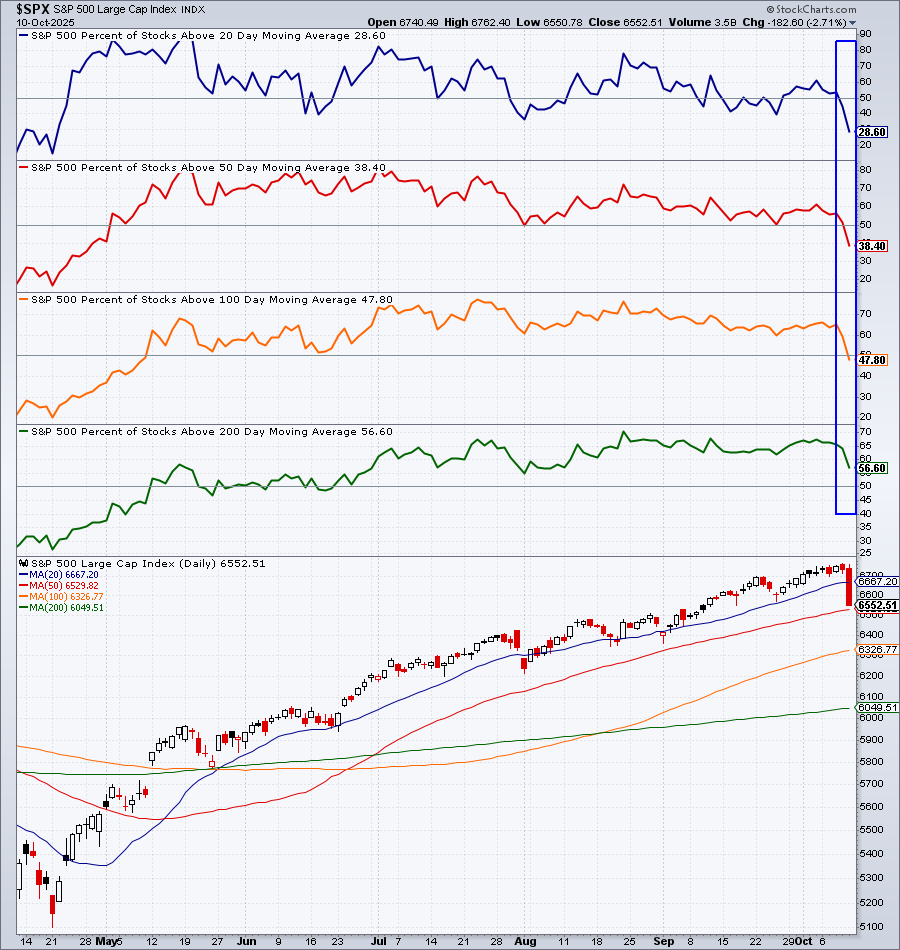
Continuing with the Market Summary page, you’ll notice several signs of softening market breadth. For example, the percentage of S&P 500 stocks trading above their key moving averages has dropped noticeably.
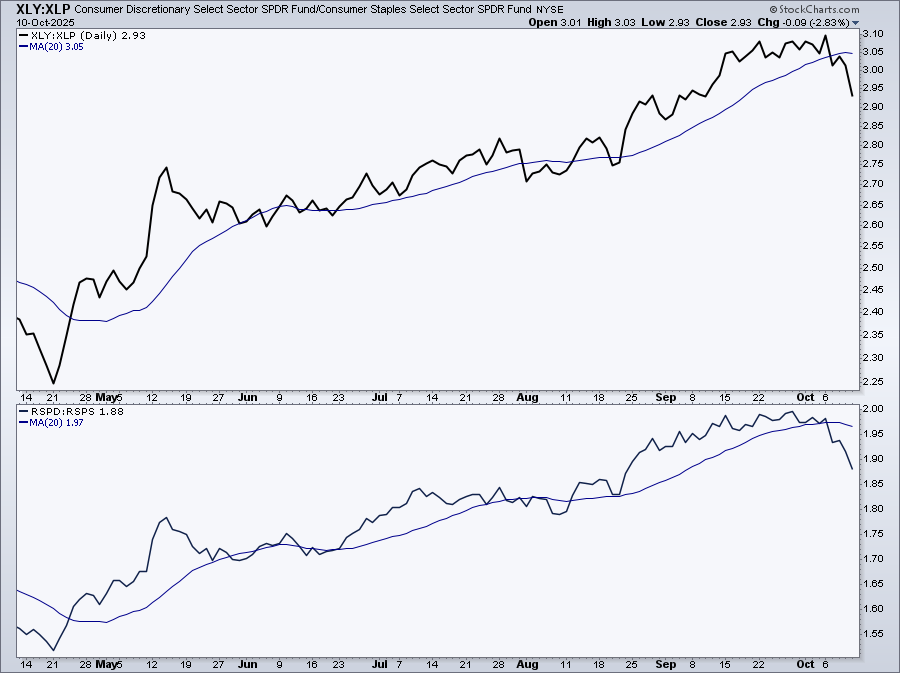
Another sign to watch is the offense vs. defense ratios. The Consumer Discretionary to Staples ratio (XLY:XLP) and the Equal-Weighted version (RSPD:RSPS) took a dive today, falling below their 20-day SMA. This suggests investors are shifting from offense to defense.
What to Watch Next Week
Let’s hope the upcoming earnings reports can give the market a reason to stabilize. In the meantime, keep an eye on sentiment, breadth, and those key support levels on your charts. With the market stretched and volatility perking up, a short-term pullback wouldn’t be surprising. The upside: it could create some buy-the-dip opportunities. It’s a good time to tidy up your ChartLists and keep a close eye on stocks you wish to own.
One last thought: Review the Market Summary page regularly. If political headlines keep surfacing, we could see more choppy sessions ahead.
Disclaimer: This blog is for educational purposes only and should not be construed as financial advice. The ideas and strategies should never be used without first assessing your own personal and financial situation, or without consulting a financial professional.


