AMD Earnings Fallout: What a Break Below $200 Would Really Mean

Shares of Advanced Micro Devices (AMD) dropped significantly on Wednesday after a painful earnings miss. While AMD did trigger my price alert of $200 during the day, I’m waiting for a close below this support level before I get really concerned about a new downtrend.
This seemed like a perfect opportunity to review how I define a chart as in one of three phases at any moment: an accumulation phase (uptrend), a distribution phase (downtrend), or a consolidation phase (sideways trend). Let’s start by breaking down the daily chart of AMD.
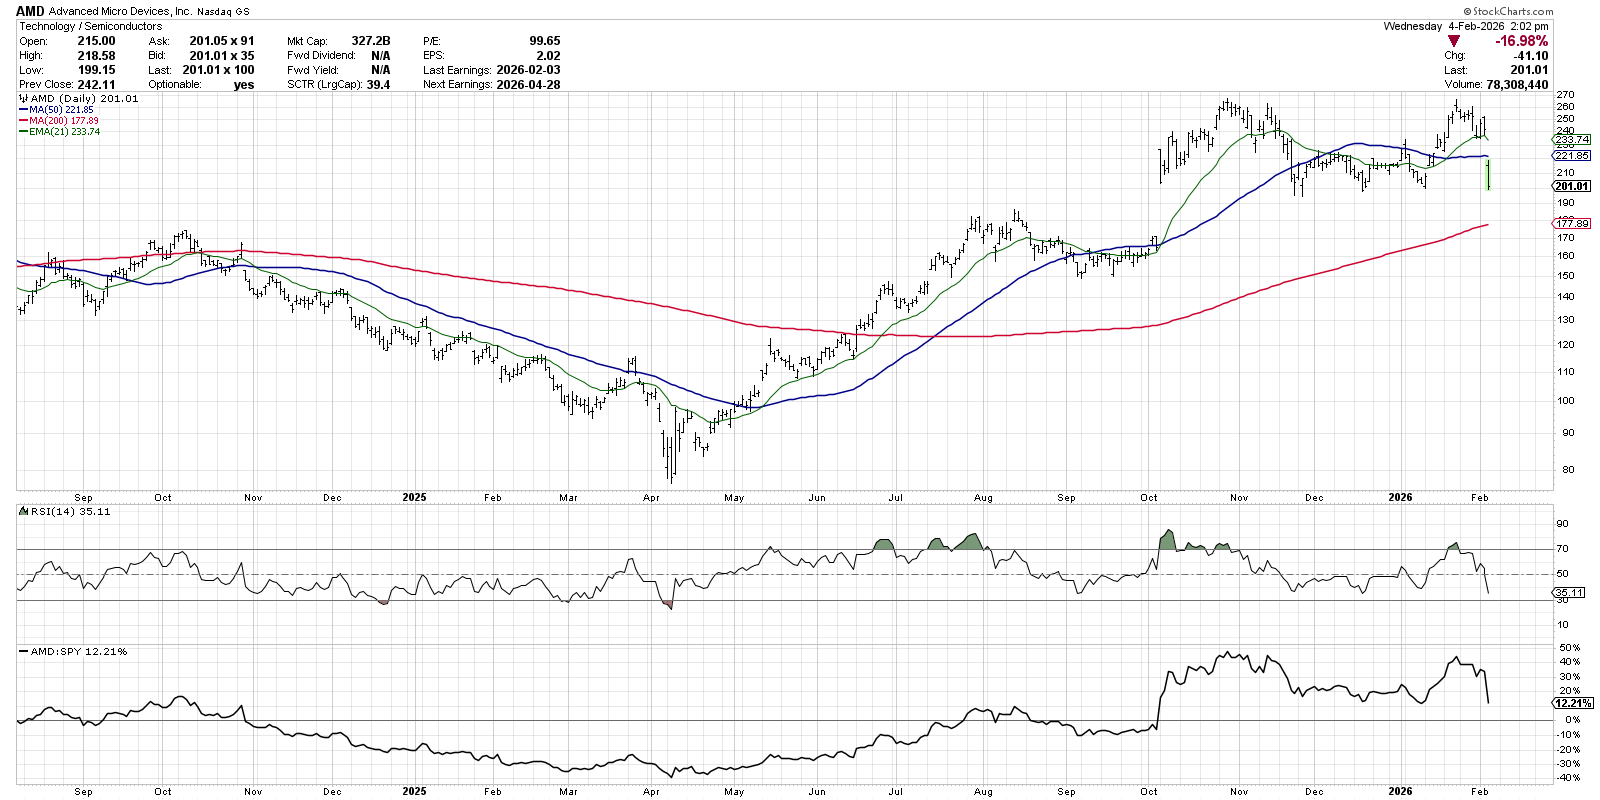
AMD has been in a consolidation phase since the price gap in early October. In fact, the stock is literally trading at the same price level today as it was after that gap about four months ago. Essentially, the stock has been trading between resistance at the October high around $265 and support around $200 based on the price gap and subsequent lows in November and December.
This is the definition of a consolidation phase, where support and resistance levels are fairly stable and the price is simply trading between the two extremes. Basically, the market is telling us that AMD is worth about $230 a share and is rotating around that equilibrium price.
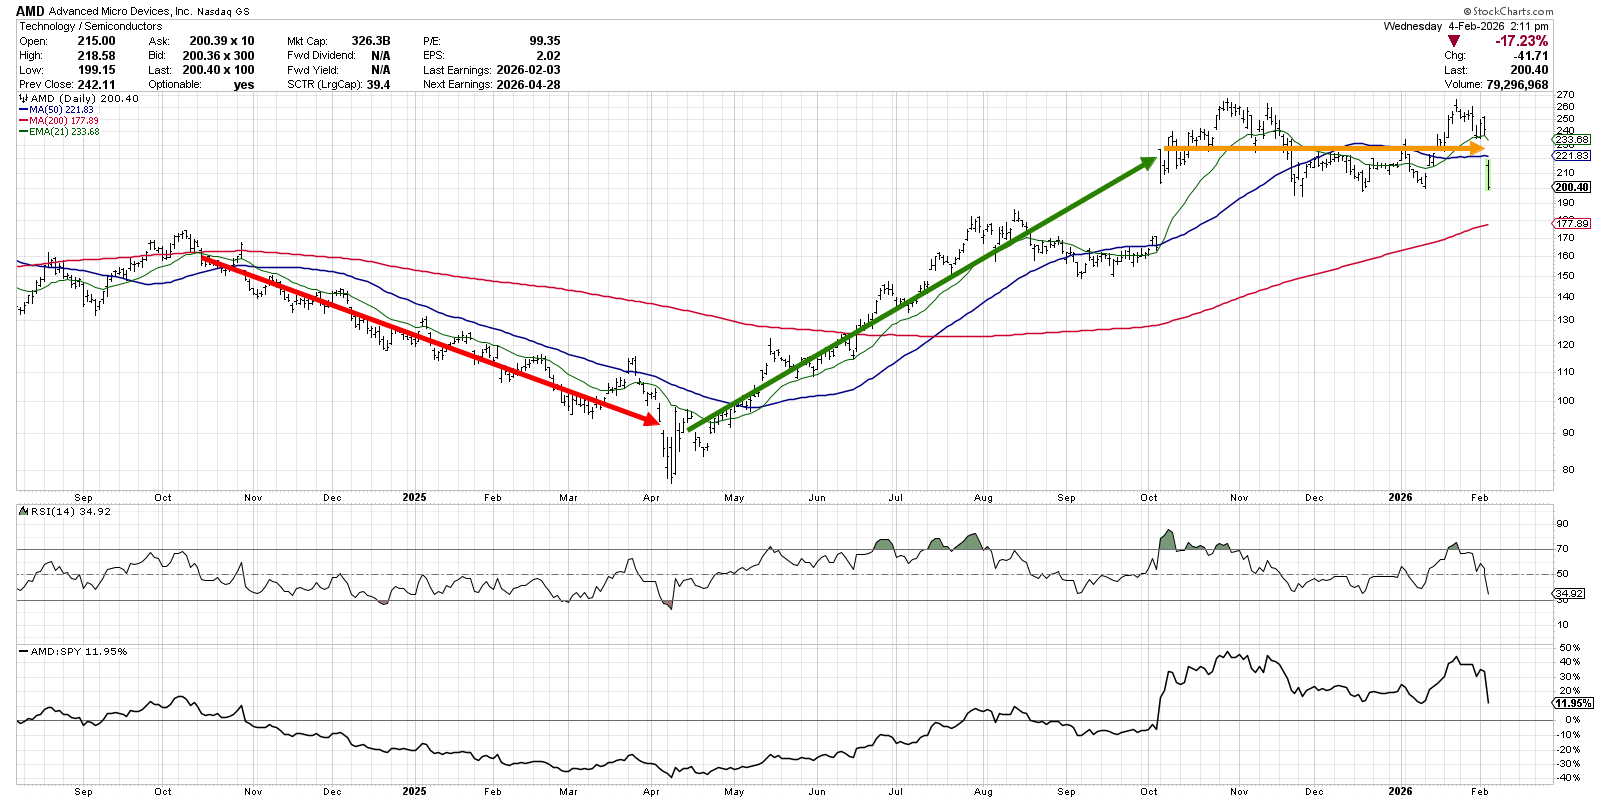
Here’s another chart where I’ve indicated the various phases that we can observe over the last 18 months. We can see a downtrend or “distribution phase” from a failed breakout above the 200-day moving average in October 2024 through the April 2025 low. A distribution phase is marked by a pattern of lower lows and lower highs, downward sloping moving averages, and price momentum mostly in the lower half of the range.
From the April 2025 low through the gap higher in October 2025, AMD was in an accumulation phase consisting of higher highs and higher lows. The moving averages were generally sloping higher during this period, and the RSI remained largely in the upper half of its range. Note how the relative performance in the bottom panel had reversed higher during this period, showing how AMD was outperforming the S&P 500.
Finally, we come to the consolidation phase which started in October, and may end this week with a confirmed break below $200. This sideways pattern is marked by stable highs and lows, where we can draw horizontal lines to represent the key support and resistance levels. The more these price levels are tested with short-term price reversals, the more the chart confirms the current consolidation phase.
In the spirit of one of my favorite market maxims, “When in doubt, zoom out,” let’s look at the weekly chart to get a better sense of how AMD has evolved through these various phases over the last seven years.
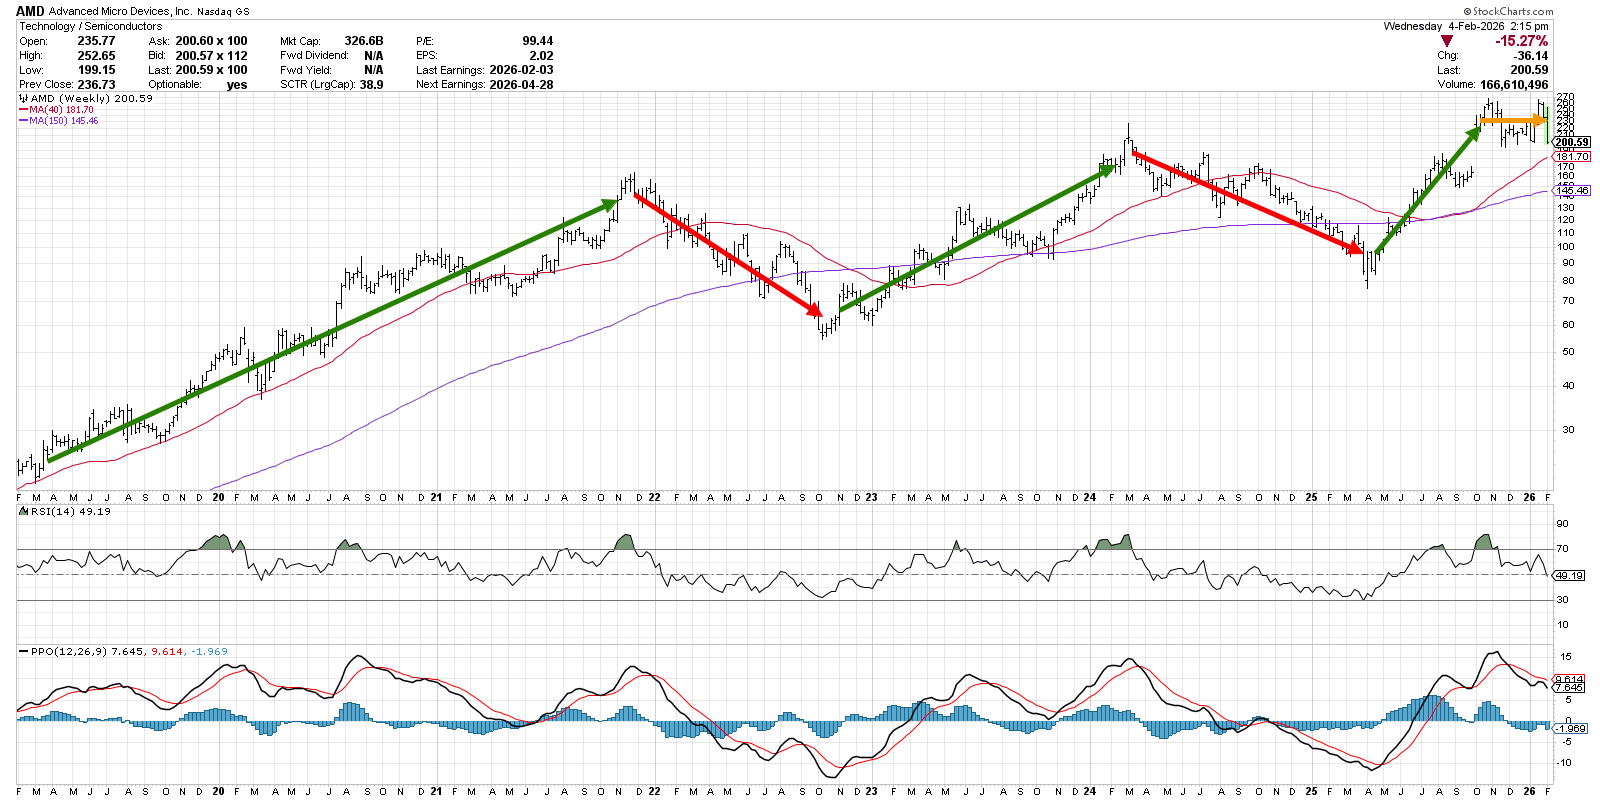
We can see here that consolidation phases are rare, at least for AMD. The price has generally rotated from an accumulation phase to distribution phase and back again. And a valid break of the 200-day moving average, or the 40-week moving average in this case, has served as a fantastic confirmation of a change in market phase.
The weekly Percentage Price Oscillator (PPO) is also shown on this chart, often helping to identify shorter-term reversals on the weekly chart. These shorter-term reversals combine to form the larger phases that evolve over a period of many months. If I’m a position trader, I’m most likely interested more in the long-term phases and confirming when they’ve changed. If I’m a swing trader, however, the short-term shifts within the phases also can provide excellent opportunities to play quick price reversals.
That brings us back to the daily chart of AMD. What exactly would we need to see to confirm a shift from a consolidation phase to a new distribution phase?
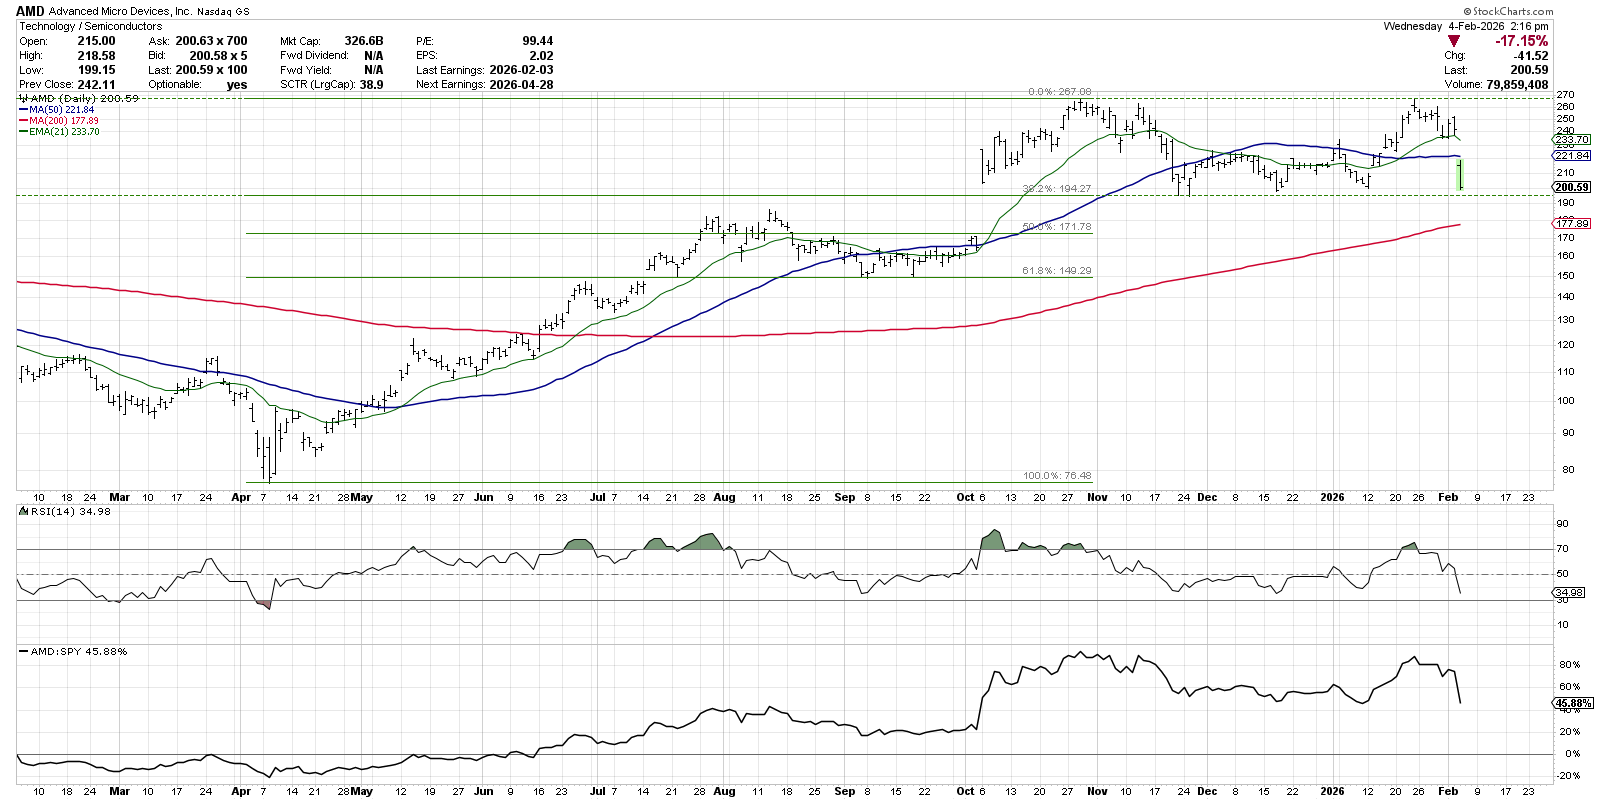
For me, it’s all about a violation of support, meaning a break below the $200 price level. In this case, a break below $194 would also mean a drop below the 38.2% retracement of the April 2025 to October 2025 bull phase. Finally, the 200-day moving average looms large just below current price levels around $178. So if AMD would clear all three of these potential areas of support, I would say that a new distribution phase was confirmed.
Legendary trader Jesse Livermore is quoted as saying, “There is time to go long, time to go short, and time to go fishing.” If AMD breaks much lower after disappointing earnings this week, fishing time may indeed be over!
RR#6,
Dave
P.S. Ready to upgrade your investment process? Check out my free behavioral investing course!
David Keller, CMT
President and Chief Strategist
Sierra Alpha Research LLC
marketmisbehavior.com
https://www.youtube.com/c/MarketMisbehavior
Disclaimer: This blog is for educational purposes only and should not be construed as financial advice. The ideas and strategies should never be used without first assessing your own personal and financial situation, or without consulting a financial professional.
The author does not have a position in mentioned securities at the time of publication. Any opinions expressed herein are solely those of the author and do not in any way represent the views or opinions of any other person or entity.