Apple Leads, Amazon Lags, Nvidia Wobbles: Sorting the Magnificent 7 by Trend Strength

While you might instinctively think of the Magnificent 7 stocks as one homogenous group of charts, it’s a fairly easy lift to identify some major differences between these leading growth stocks. From stocks like Alphabet (GOOGL) making consistent new highs to Microsoft (MSFT) pulling back to test its 200-day moving average, there’s actually been quite a bit of differentiation between the mega-cap stocks in November.
If we start to group these charts into buckets based on their technical analysis configuration, we’ll end up with four distinct categories. Let’s review one stock from each of three buckets, reflecting on what defines the charts in each category and focusing on key levels and signals to watch in the coming weeks.
The Bullish Breakout: AAPL
Without looking at the charts, I'd guess that many bulls would expect most of the Magnificent 7 charts to look like Apple (AAPL). After a sideways consolidation through November, AAPL is attempting to break to another new all-time high.
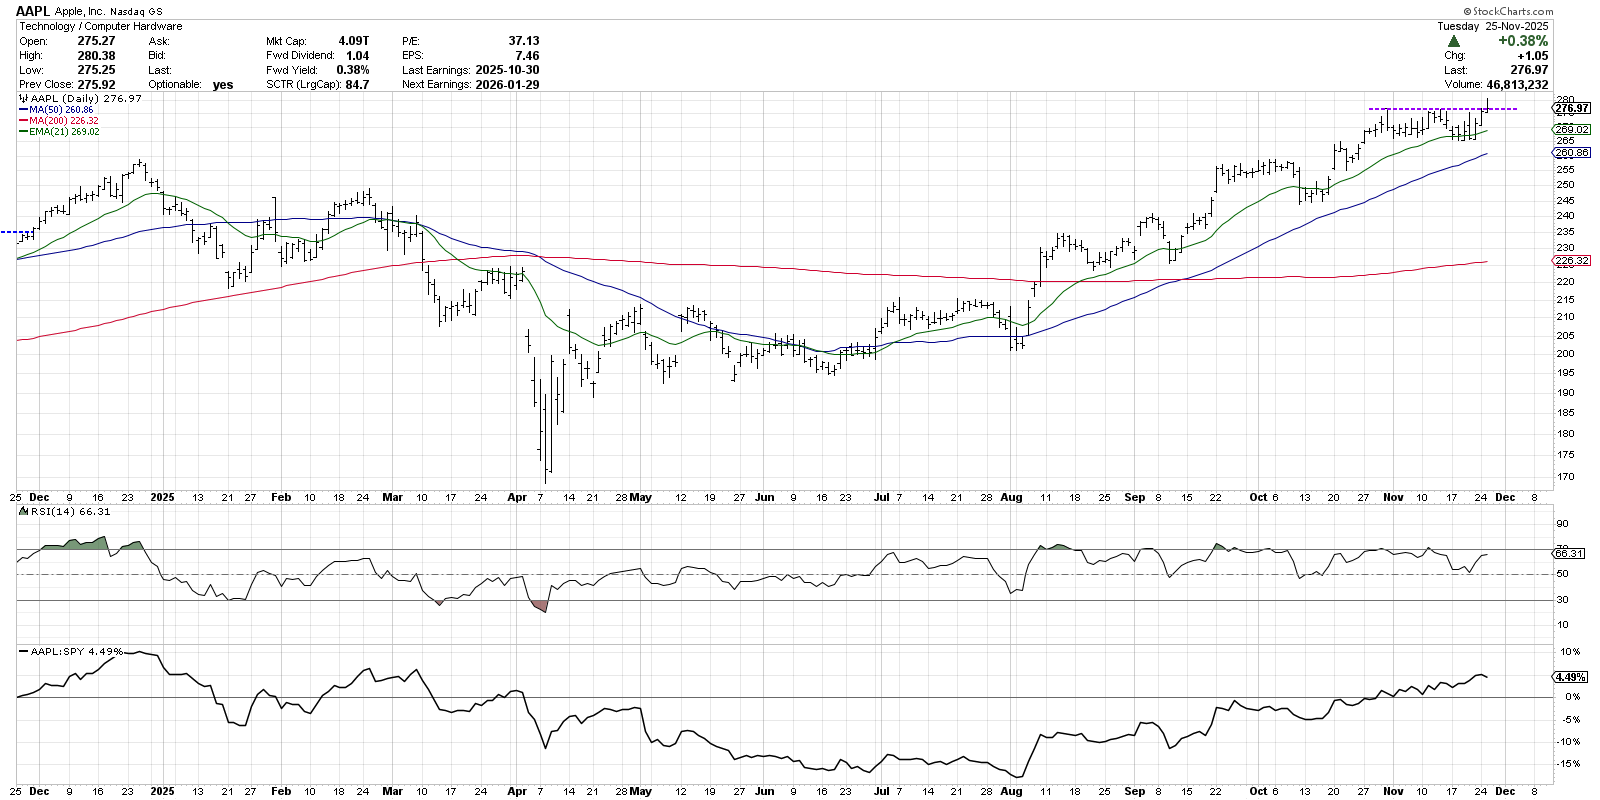
Note how each of the previous pullbacks ended at or around the 21-day exponential moving average, before the next upswing took AAPL to a new swing high. Apple is still making a pattern of higher highs and higher lows, and the moving averages are all in the proper order. The momentum remains strong, with the RSI remaining largely above the 50 level since the beginning of August.
BLACK FRIDAY SALE! If you’ve been thinking about leveling up your investing, now’s the time—get 40% off your first year of Market Misbehavior Premium Membership with code SPXDAVE. You’ll get weekly insights, monthly webcasts, and full access to our member community and resource library. Grab the savings while they last!
I consider charts like this “innocent until proven guilty” in that the trend is clearly positive. Until and unless there is some “change of character” in terms of price or momentum or both, I’m inclined to assume that uptrends like this would persist. The most recent swing low around $265 would be an initial support level if we see any weakness into early December.
The Earnings Disappointment: NVDA
Any time someone claims that the market remains strong because the AI trade keeps working, I like to point out the chart of NVIDIA (NVDA), which is showing several concerning signs in November 2025. From the failed breakout in late October to the lack of willing buyers after last week’s earnings report, this looks more like a chart under pressure than a strong uptrend phase.
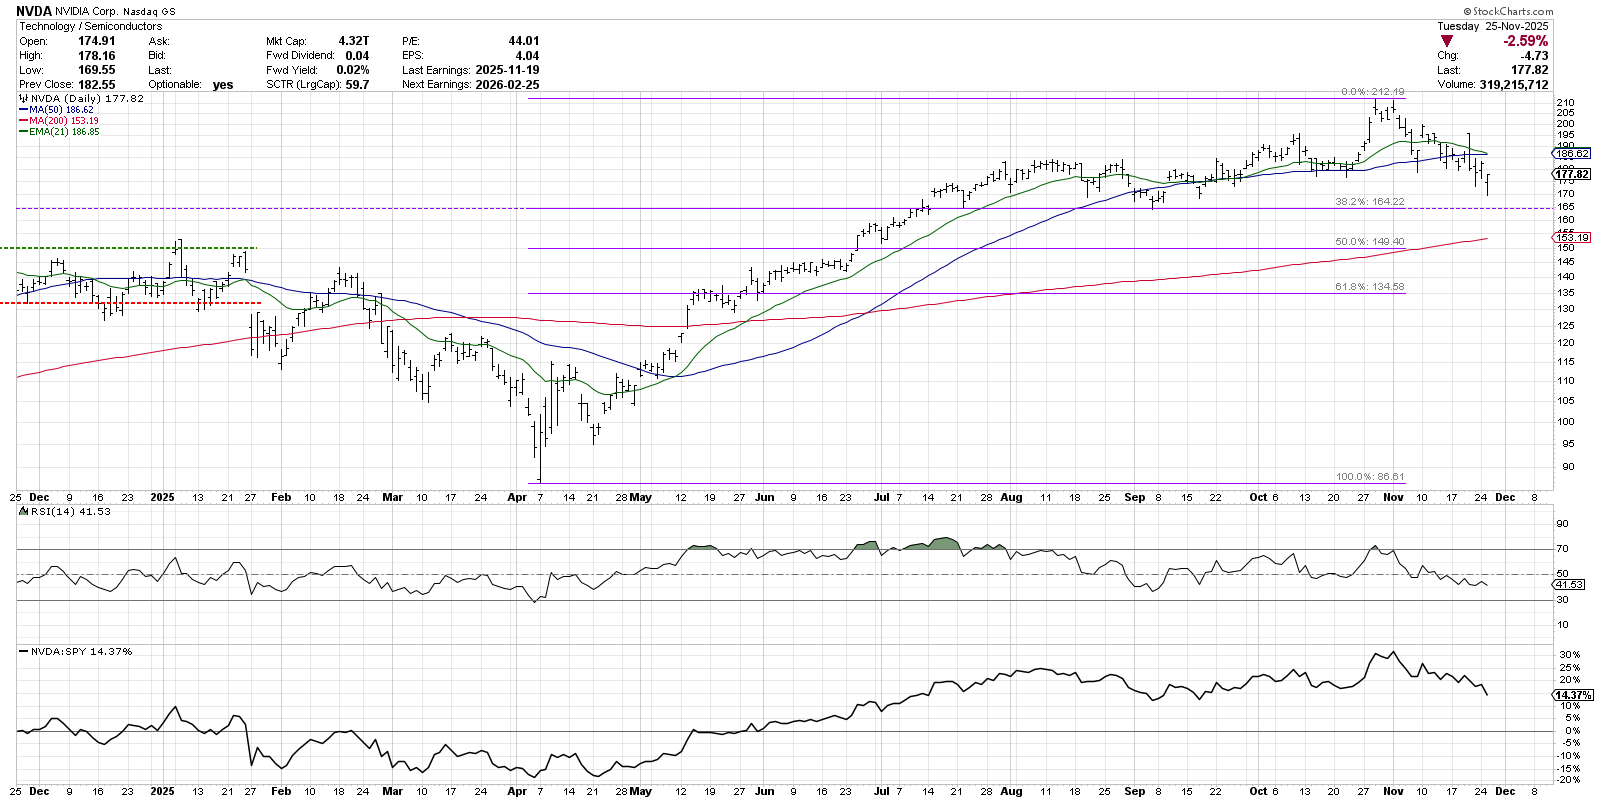
The last week of October saw NVDA push to a new all-time high, seeming to announce the return of AI dominance. But after a gap higher pushed NVDA to a new peak around $212 on October 28, the stock quickly dropped to test the 50-day moving average. Those waiting for a relief rally after a stellar earnings report last week were disappointed, as a gap higher on Thursday, November 20, was quickly sold off.
This week, we’re seeing NVDA drift lower as it nears potential support at the 38.2% retracement level and the major low in September around $164. With NVDA testing a crucial support level, and the RSI holding steady just above 40, this chart appears very close to a major breakdown. If NVDA confirms a break below $164, we’d be looking for additional support at the 200-day moving average and perhaps even to the 61.8% retracement around $135.
The Imminent Breakdown: AMZN
Shares of Amazon (AMZN) tested the 200-day moving average on Friday of last week. While this top Consumer Discretionary name has bounced higher so far this week, we’re looking for improved momentum readings and a higher price low to confirm a new accumulation phase.
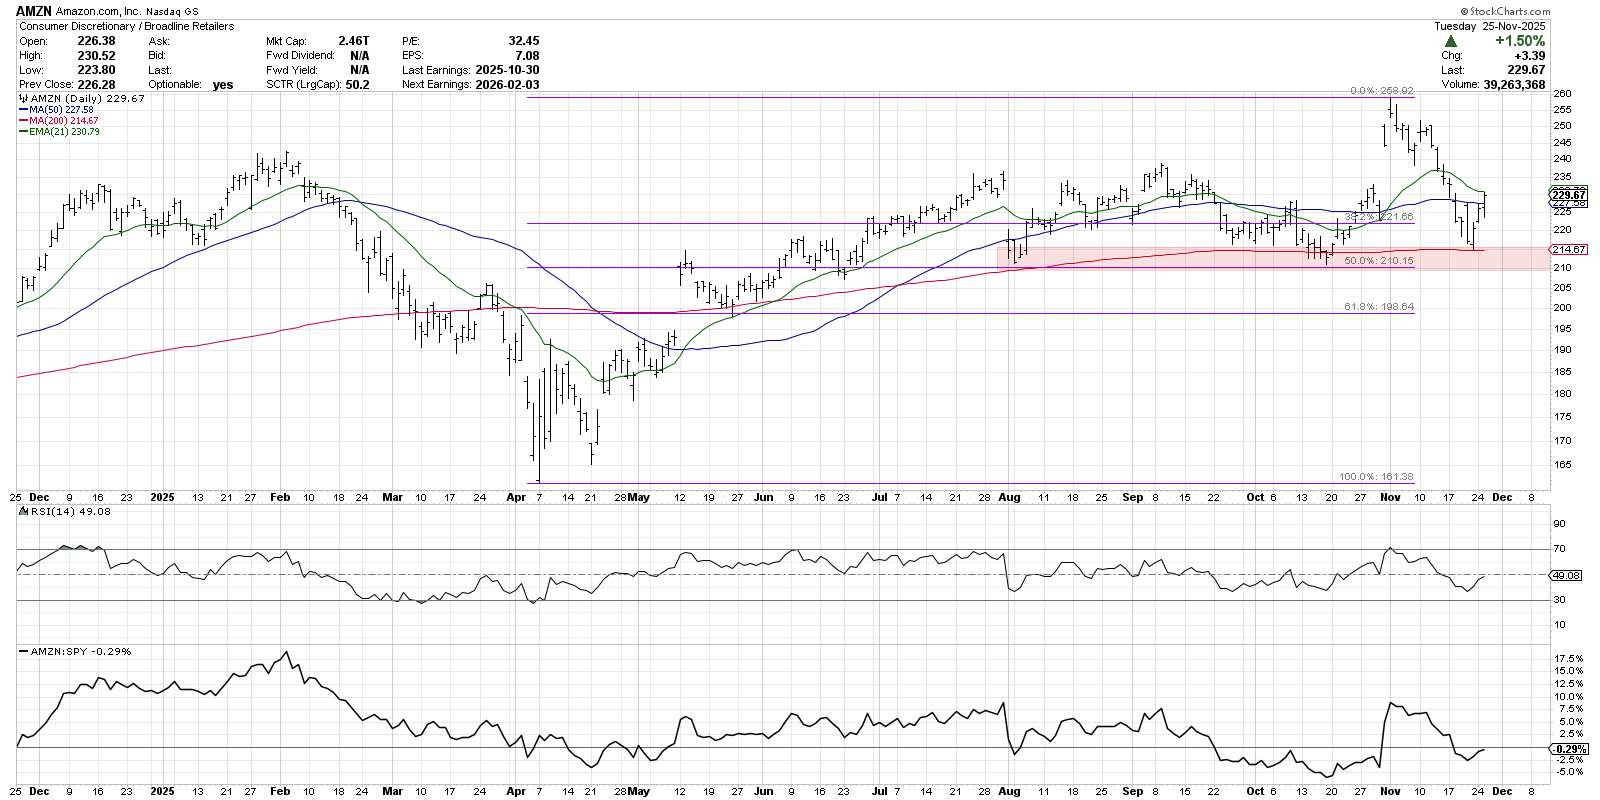
The daily RSI hit right around 40 as AMZN tested the 200-day moving average, which means the momentum remains overall in a bullish range. Here we’re showing a support range which is based on the 200-day moving average, the swing lows in August and October, and the 50% retracement of the April to November uptrend phase.
For now, the AMZN's chart remains decidedly neutral. With the price back in the August–September consolidation range, and the 200-day holding as support, we wouldn't consider this a breakdown yet. But the bear case for the S&P 500 and Nasdaq 100 would most likely involve charts like Amazon failing to hold support. So this is perhaps the most important chart to watch, as weakness can often lead to much further weakness as selling pressure builds!
Depending on the technical configuration of a particular chart, some technical indicators can be more or less helpful in confirming a new trend phase. By grouping the top growth stocks into specific buckets and laying out a game plan specifically for each category, you can better manage risk and identify areas of potential strength.
For a deeper dive on each of the Magnificent 7 stocks, along with further details on how I’m approaching the charts in each of the four buckets, check out my latest show on StockChartsTV!
RR#6,
Dave
P.S. Ready to upgrade your investment process? Check out my free behavioral investing course!
David Keller, CMT
President and Chief Strategist
Sierra Alpha Research
marketmisbehavior.com
https://www.youtube.com/c/MarketMisbehavior
Disclaimer: This blog is for educational purposes only and should not be construed as financial advice. The ideas and strategies should never be used without first assessing your own personal and financial situation, or without consulting a financial professional.
The author does not have a position in mentioned securities at the time of publication. Any opinions expressed herein are solely those of the author and do not in any way represent the views or opinions of any other person or entity.


