Are Investors Too Bearish? What Sentiment Signals Say About Stocks Now
Key Takeaways
- Bearish sentiment ticks up across surveys, fund managers, and options positioning indicators.
- Elevated VIX and defensive shifts may signal caution, but also potential opportunity.
- Positioning suggests grind-lower risk, not necessarily a sharp market capitulation scenario.
Are investors too bearish? A growing number of indicators point to pessimism perking up as the war in Iran nears its fourth week.
Last Thursday, the AAII Investor Sentiment Survey was flush with bears—more than 46%—while just 31.9% of weekly respondents were bullish about stock prices over the next six months. Only 21.9% said the volatility “created a buying opportunity.”
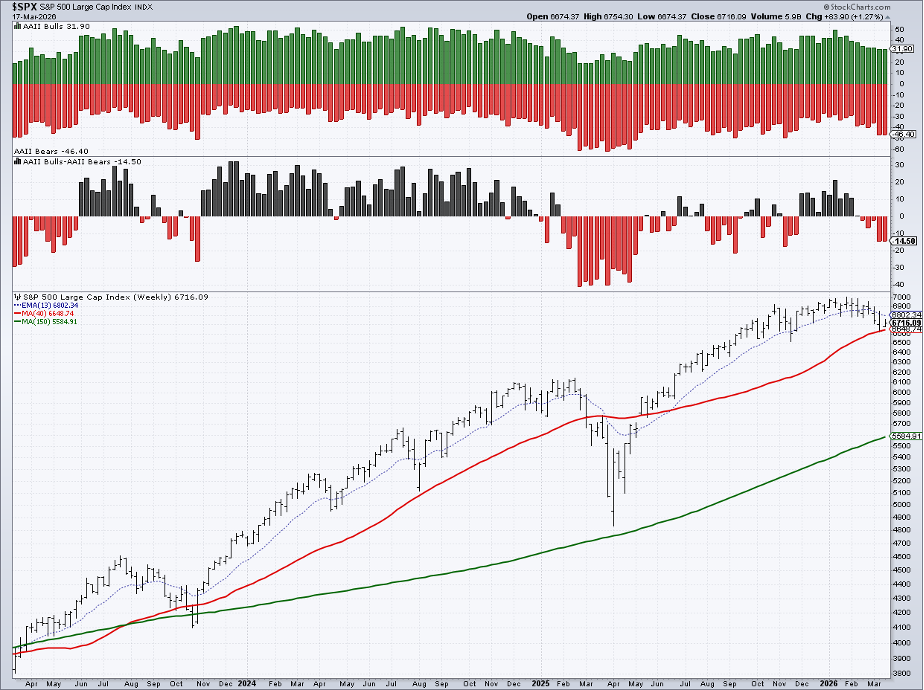
Cash Creeps Higher
Then, earlier this week, the BofA Global Fund Manager Survey revealed that portfolio managers increased their cash hoards by the most since 2020. To be clear, they are not all that defensively positioned at 4.3%, but the cautious turn certainly registered on a long-term chart. (As we know, indicators like the mutual fund cash ratio are inherently contrarian.)
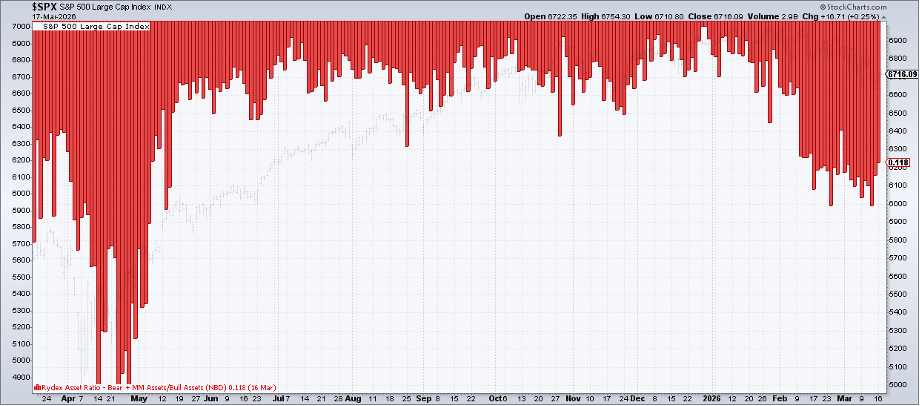
Following the Flows
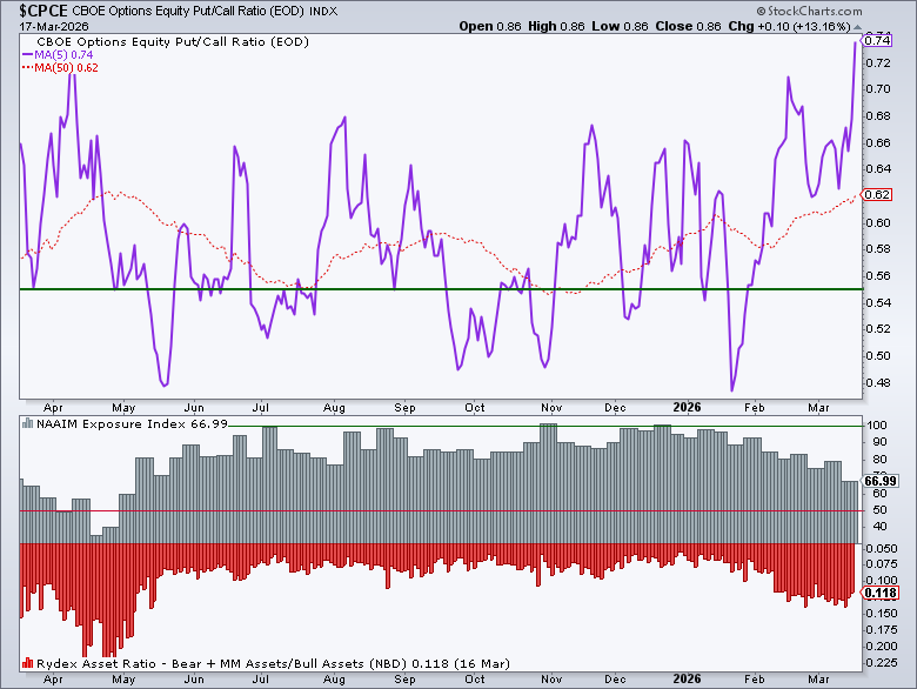
Related to the BofA FMS Q&A, the Rydex Asset Ratio is a sentiment indicator that measures where allocators are putting their money by comparing bearish and bullish fund assets. While not close to the depths of the immediately aftermath of Liberation Day 2025, the bears clearly have a swagger today.
The Rydex ratio is easy to interpret. A high ratio indicates equity pessimism, with investable assets parked in money markets and bear funds. This is often viewed as a bullish signal for the market (an oversold condition).
Risk Appetite Fades
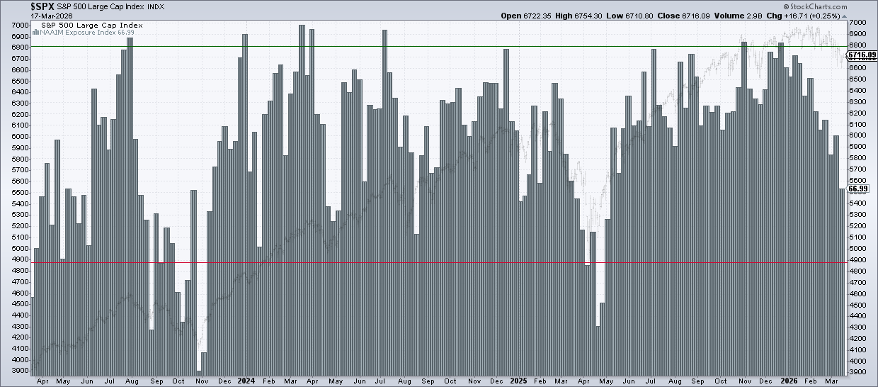
At the same time, the NAAIM Exposure Index ticked down to 66.99 as of March 12. The lowest reading since April 2025, it’s clear that aggressive bets on US stocks are less common across the investor spectrum as the first quarter’s end draws near.
A Quiet Move to Safety
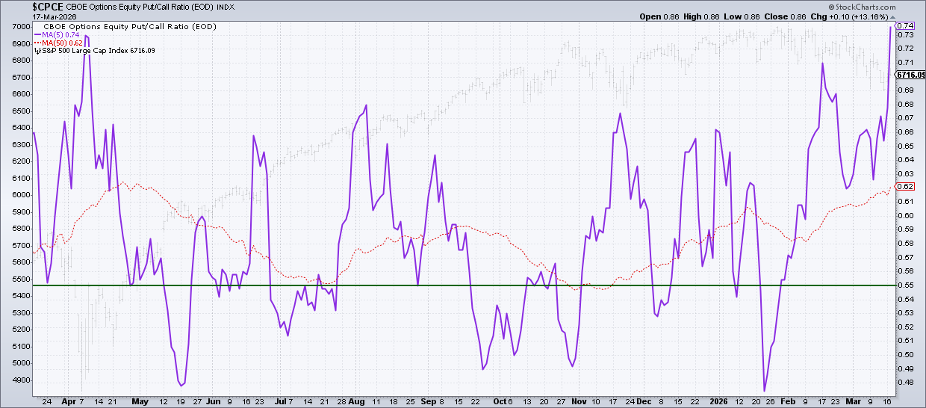
From global PMs to individual investors, the stair-step to safety is in full bloom, with the first day of spring coming this Friday. The Cboe Options Equity Put/Call Ratio ($CPCE) printed a fresh YTD high on St. Patrick’s Day, suggesting that active traders are well-hedged for whatever the next geopolitical headline delivers.
Hedging the Headlines
Indeed, sentiment and positioning are in vogue right now. Some grizzly market-watchers would prefer to see a classic capitulation moment for the S&P 500, sort of like a mini-version of what occurred amid the tariff tantrum. Others prefer the bulls slowly grab control of the primary trend once again, like the inverse of how the SPX’s rounded topping formation has played out.
Your Sentiment Dashboard
The truth is, there’s never a precise script. Traders must parse price-action information to determine signal from noise, then take those real cues in aggregate.
In such a time as this, the StockCharts Sentiment page within the Market Summary view is quite practical. The VIX, put/call ratio, equity put/call, index put/call, NAAIM Exposure Index, Rydex Asset Ratio, and the weekly AAII survey results are at your ready.
Reading the Fear Gauge
What jumps out to me? I’m particularly encouraged by recent VIX trends.
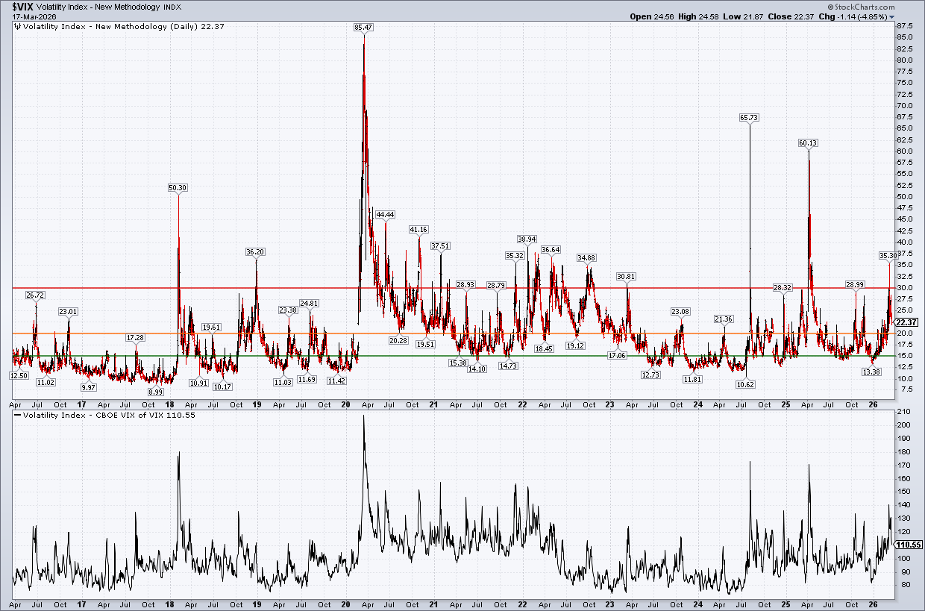
Wall Street’s fear gauge spiked to 35.3 on March 9 (a rather famous day in market history). It was the highest level since April 21, 2025. Zoom out the chart and we find that mid-30s readings often mark S&P 500 lows. It’s extremely rare for the VIX to scale the mid-50s and beyond (there are just three instances in its history—not counting August 2024, when an anomaly in the options market distorted the VIX calculation).
Having settled back to the low 20s, the spike to 35 looks increasingly like a tradable stock market low. The bears can counter with historical data showing weak future S&P 500 returns when the VIX is above 20 but below 30. Moreover, we don’t have to go back far to find a period in which volatility ranged from the high teens to the high 30s, as the 2022 bear market began with a whippy VIX.
To that point, many options traders lean on the Cboe VIX of VIX (VVIX) for breadcrumbs on future volatility trends. VVIX settled between 100 and 150 for the better part of two years before easing in the back half of 2022.
The upshot? Elevated volatility could be here to stay for a while.
Supply Overhang Looms
For longer-term investors, it may be a good thing that traders are buying protection and erring on the side of caution. If the market is braced for a shock, it’s more difficult for a bearish catalyst to truly rattle the system.
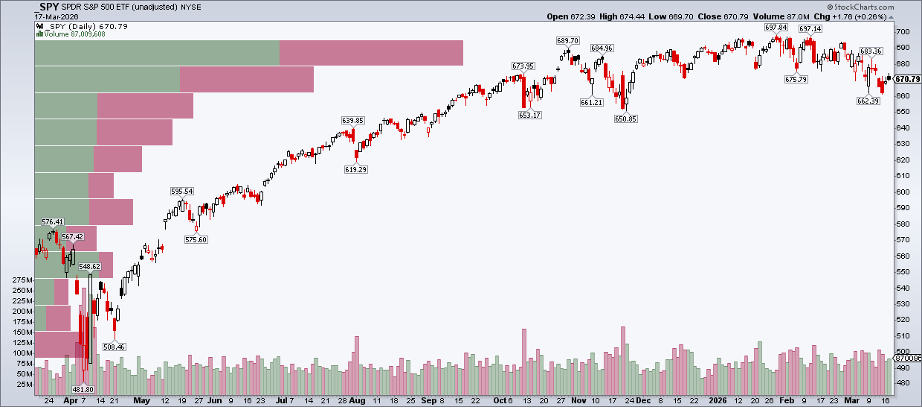
But it’s also true that rallies may be sold into, particularly as there’s now a high amount of volume-by-price (overhead supply) on the S&P 500’s chart and so many others.
Bottom Line
I assert that a grind-lower market is the more likely bearish scenario, rather than an extreme decline. Investor positioning, sentiment gauges, and the S&P 500’s rounded top all seem to lean that way. Also, remember that most investors are often correct. It's only at sentiment extremes that you want to be a contrarian.
So, I have the StockCharts Sentiment page bookmarked. It will probably be referenced often as 2026 progresses.
Disclaimer: This blog is for educational purposes only and should not be construed as financial advice. The ideas and strategies should never be used without first assessing your own personal and financial situation, or without consulting a financial professional.