Friday Chart Fix: 2024 vs. 2025, Commodities with a Dash of Crypto, Moment of Truth for IWM, The Tesla Squeeze
Welcome to your Friday Chart Fix. Today, we start with the difference between the 2024 bull market and the 2025 bull run.
The S&P Total Market Index ETF hit new highs in July, but 2025 breadth is not what it was in 2024. Small-caps are weighing on the broader market as the Russell 2000 ETF battles its 200-day SMA. Even though QQQ is leading the major index ETFs with a double-digit gain year-to-date, Bitcoin and Gold are up twice as much as QQQ. Oddly enough, strength in Bitcoin may be helping the Continuous Commodity ETF (GCC). Finally, we close with Tesla as the Bollinger Bands squeeze price.
Key Takeaways
- S&P 1500 %Above 200-day moving average has yet to clear 60% in 2025.
- Russell 2000 ETF is back above 200-day SMA.
- Gold and Bitcoin are leading the All Weather dozen.
- Continuous Commodity ETF (GCC) has less oil and a touch of crypto.
- A Bollinger Band squeeze is working for Tesla.
Majority of S&P 1500 Stocks in Downtrends
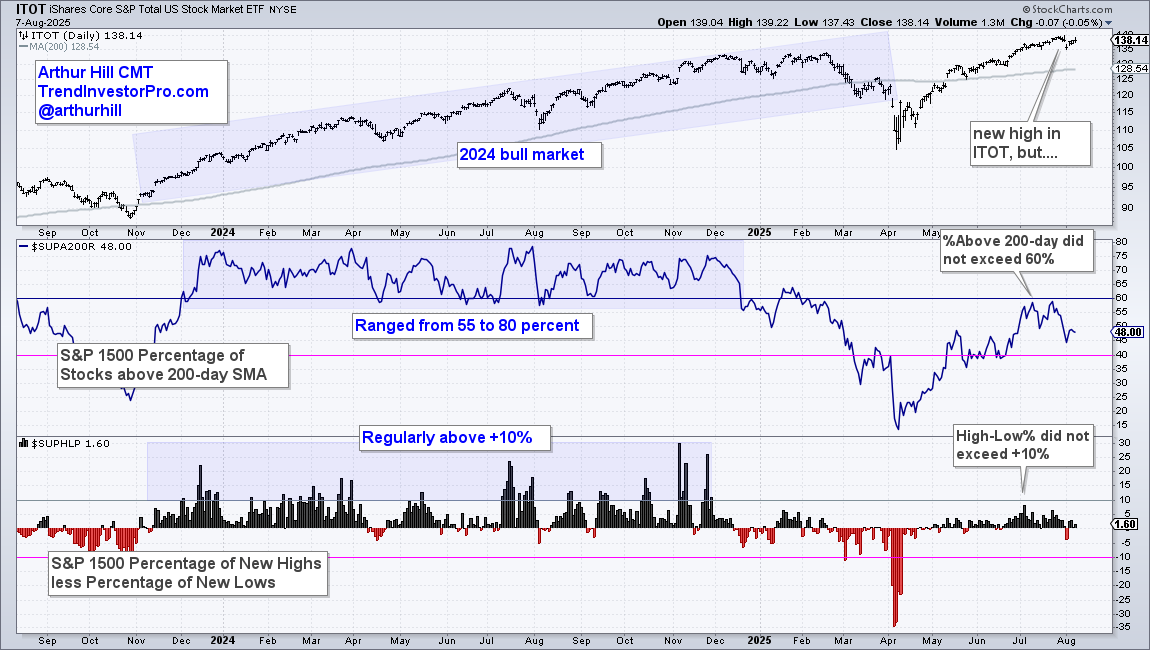
The S&P Total Market Index ETF (ITOT) hit a new high, but the 2025 bull run is not the same as the 2024 bull run. In 2024, S&P 1500 %Above 200-day SMA ($SUPA200R) ranged from 55% to 80%, and S&P 1500 High-Low Percent regularly exceeded +10% (blue shading). In 2025, %Above 200-day has yet to exceed 60% and High-Low Percent has yet to exceed +10%. ITOT hit new highs in July, but the internals reflect a split market, as 48% of S&P 1500 stocks are above their 200-day SMA. This means 52% are below.
IWM Battles 200-day SMA
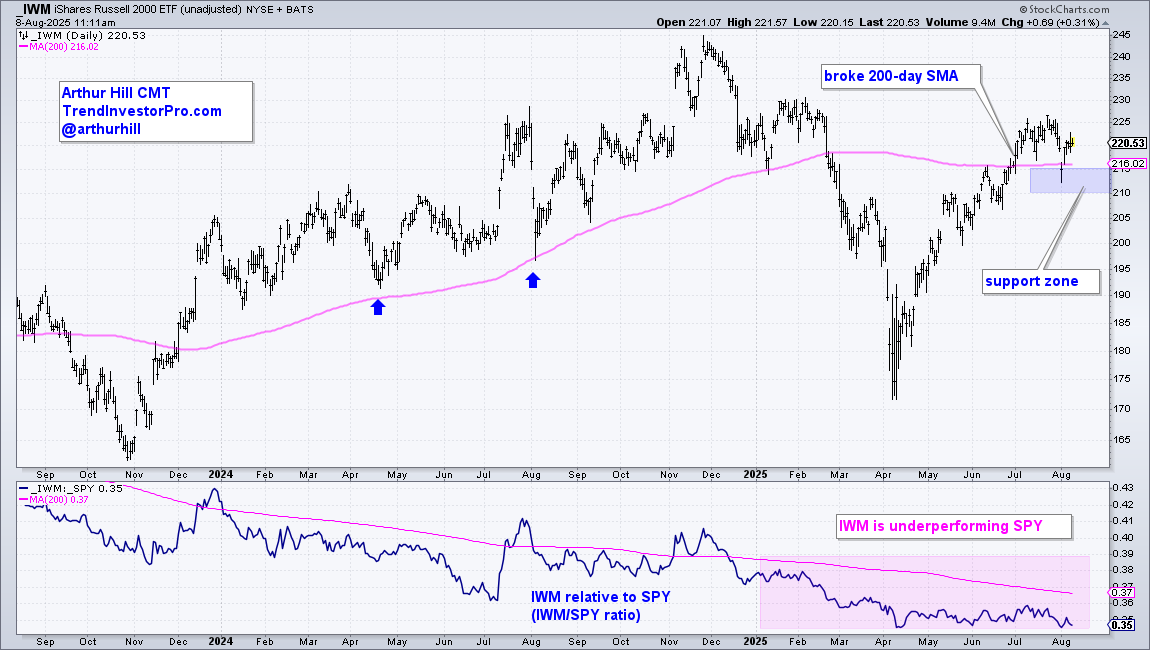
The iShares Russell 2000 ETF (IWM) broke above its 200-day SMA on July 1st and is largely holding above this key moving average. Notice how the 200-day SMA acted as support in April and August 2024 as the ETF advanced last year (green arrows). IWM took a hit on August 1st with a close below the 200-day, but immediately bounced back. This establishes a support zone in the 210-215 area. A close below 210 would decisively break the 200-day and reverse the four-month upswing.
Recent reports and videos at TrendInvestorPro:
- A classic continuation pattern for the Gold SPDR.
- DB Base Metals ETF maintains upswing - key level to watch.
- Four stocks with bullish breakouts (including a cloud play).
- A sentiment indicator signals excess and triggers bearish.
Click here to learn about subscriber bonuses and a trial offer.
Gold and Bitcoin Lead as Small-caps Lag
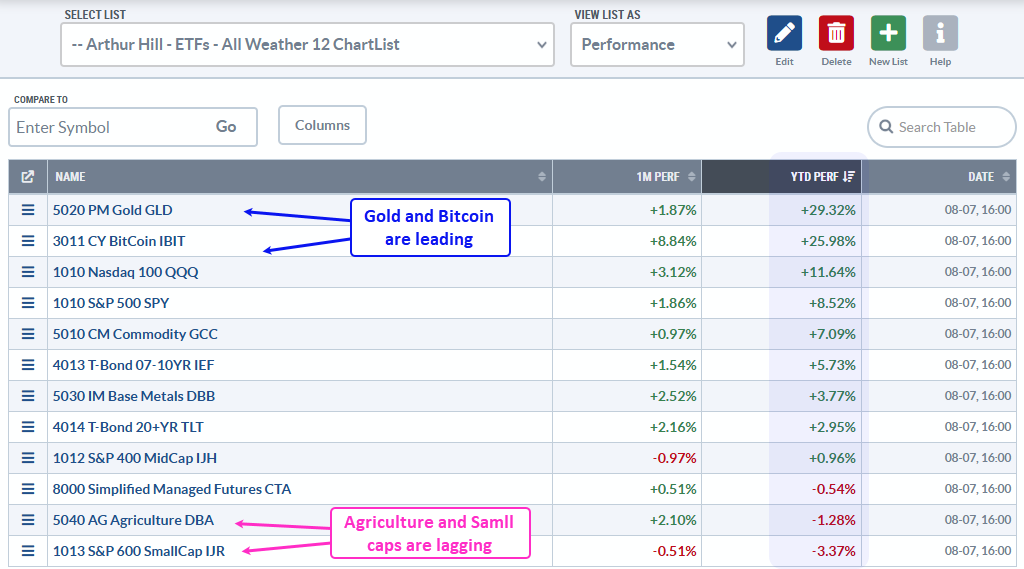
The table below shows 1-month and year-to-date performance for 12 All Weather ETFs. It is sorted by year-to-date performance, with the SPDR Gold Shares (GLD) and Bitcoin ETF (IBIT) showing the biggest gains. Both are up more than double QQQ. The Continuous Commodity ETF (GCC) and 7-10Yr TBond ETF (IEF) are having a pretty good year, with gains greater than 5%. The S&P MidCap 400 ETF (IJH) is struggling, while the S&P SmallCap 600 SPDR (IJR) is the laggard with a 3.37% year-to-date loss.
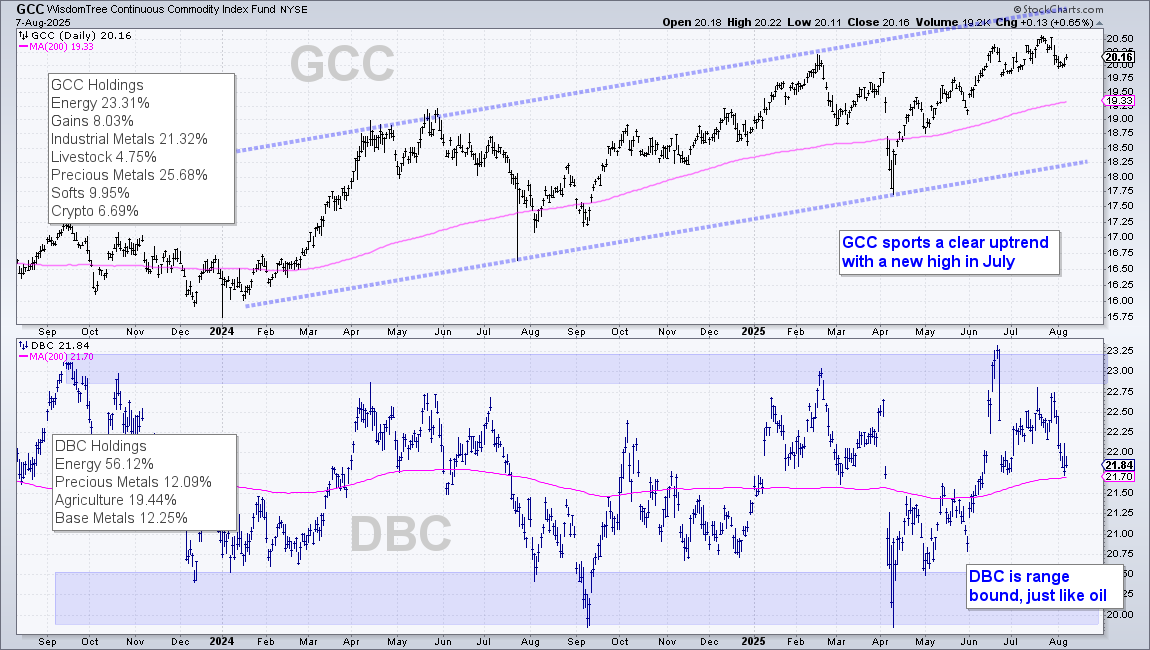
A Broad Commodity ETF with a Touch of Crypto
The DB Commodity ETF (DBC) is the most widely-traded commodity ETF, but it is heavily weighted towards energy (56.12%). The Enhanced Commodity ETF (GCC) is more balanced, with energy weighing less than a quarter (23.31%). GCC also includes some crypto (6.69%), which I did not know qualified as a commodity. Check out the WisdomTree website for more. Average volume is extremely low, but this ETF can be used as a broad commodity tracker because it is more balanced. The top window shows GCC in a clear uptrend, with a new high in July. This means a bull market for commodities. The lower window shows DBC in a trading range, just like oil.
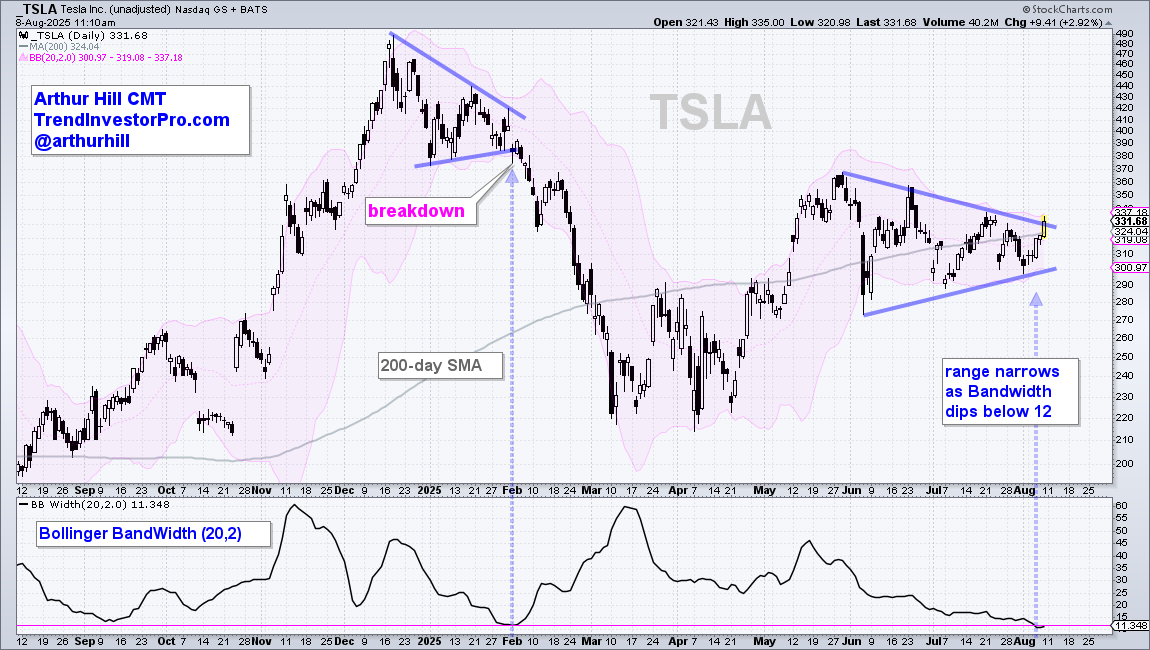
A Bollinger Band Squeeze for Tesla
The chart below shows Tesla, Inc. (TSLA) with Bollinger Bands (pink shading) and BandWidth (20,2). Notice how the Bands contracted the last few weeks and Bandwidth dipped below 1.2 for the first time since early February. This reflects a volatility contraction that could give way to a volatility expansion. The price chart shows a contracting range with a triangle forming. The direction of the break will dictate the next directional move.
See TrendInvestorPro for more chart analysis and videos.


