Apple's Strongest 2-Day ROC Since April: Breakout or Bull Trap?

Key Takeaways
- Apple (AAPL) jumped 8.4% from Wednesday through Thursday, its best two-day gain since April; shares are soaring again heading into the weekend.
- The stock is now above its 200-day moving average, and there are broader market implications.
- The low-vol factor is one to watch, along with trends in the Nasdaq 100 ETF (QQQ).
Mr. Cook went to Washington, and the Apple (AAPL) CEO worked out a deal with President Trump. Now the world’s third-largest company by market value, it’s largely exempt from some of the extreme tariff rates, though some products manufactured in India could face elevated levies. Call it an Apple-flavored TACO.
Price action told the story. AAPL rallied 8.4% between Wednesday and Thursday, giving a much-needed lift to the embattled mega-cap. I like to apply the Rate of Change (ROC) indicator when performance turns explosive to get a sense of the magnitude of a thrust. For AAPL, the back-to-back session ascent was the best since the S&P 500’s bottom on April 9.
AAPL: Shares Rally Above Resistance After a Strong Two-Day Gain, 200-DMA In Play
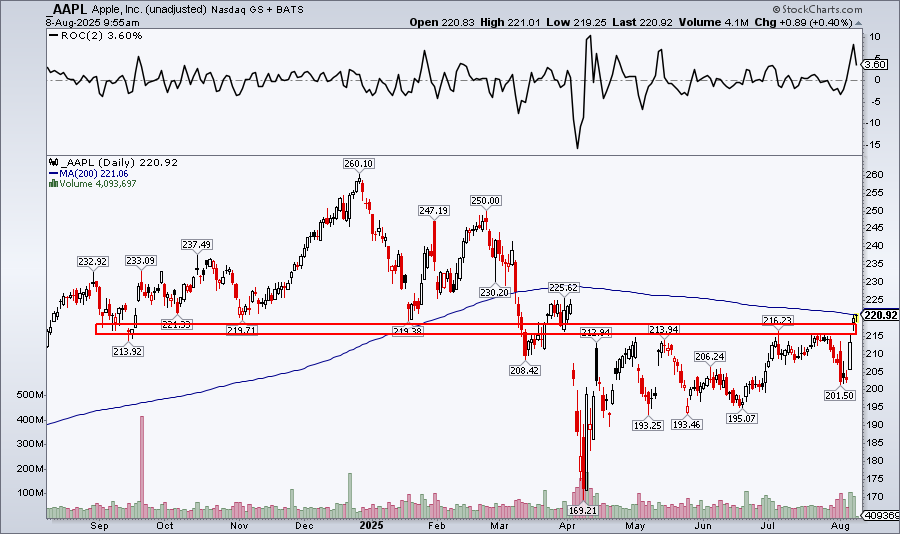
AAPL’s chart leaves a pair of price gaps, which will bear watching should we see a retreat as the sometimes-sketchy August-through-September period plays out. The first gap is at Thursday’s closing level of $213, while the second is from last Wednesday, about $10 further down. The stock traded north of $220 toward the end of this week, so it would take a material correction for the lower gap to get filled.
The bulls appear to be gaining control of the primary trend, but it’s not a done deal. Key to watch will be how AAPL trades around its 200-day simple moving average (SMA). Obviously, it would be ideal for the stock to settle above the 200-day SMA on a weekly closing basis, but, since that long-term trend indicator line is downward-sloping, the bears still have their claws on shares to an extent.
Also, take a look at the red support/resistance zone I have annotated on the chart above. The battle zone ranges from the mid-$210s to near $220. A close above that range helps support the case for a broader trend reversal.
Still, a high amount of volume by price exists up to about $250. That's a significant supply of shares that will make rally attempts tough on the bulls. Given the recent range between $193 and $215, though, a measured move upside price objective to (call it) $237 is in play. $250 is another upside spot to watch.
Zooming out, AAPL’s climb could reinvigorate a left-for-dead factor: low volatility. AAPL is not a constituent of the Invesco S&P 500 Low Volatility ETF (SPLV), but it’s among the least volatile Mag 7 members.
I like to compare ETFs to the S&P 500 for a gauge of relative strength. The chart below plots SPLV against the S&P 500 ETF (SPY). So far this year, SPLV has returned 6%, which is not too far from SPY’s 8.5% performance. It has been a tale of two halves (so far) regarding SPLV, though. The low vol factor crushed the market through mid-April, but the past four-plus months have been a 180 relative-strength reversal. High beta and risk-on have dominated.
SPLV Trying to Bounce vs. SPY
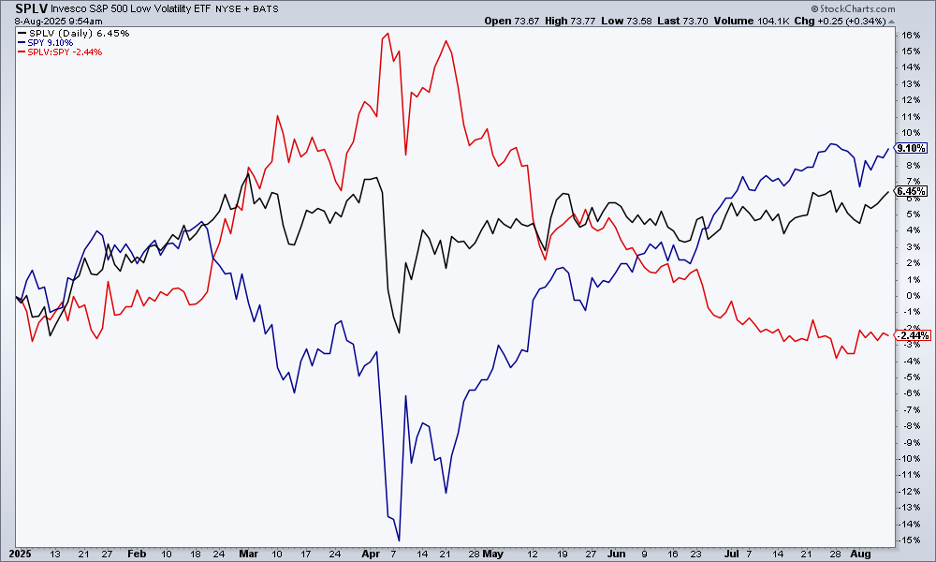
Perhaps I am getting too granular, but SPLV:SPY appears to be hooking higher in the past two weeks. It would make sense seasonally, as low vol has outperformed the US large-cap ETF, on average, in August and September over the past 14 years, according to StockCharts’ Seasonality tool. I’ll be keeping my eye on this relationship—SPLV alpha would likely indicate some of the YOLO froth coming out of the market.
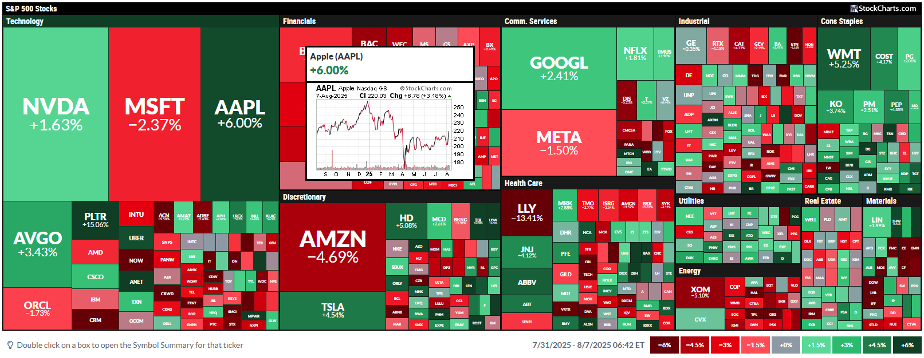
Another take on AAPL’s renaissance is that healthy market rotation could be underway; bull markets often pass the torch from one outperforming theme to another. Among the Mag 7, AAPL has been the top dog over the past five days. To be clear, we need to see a more protracted period of outperformance to confirm such a rotation.
S&P 500 Performance Heat Map Last Five Days: AAPL’s +6% Jump Stands Out
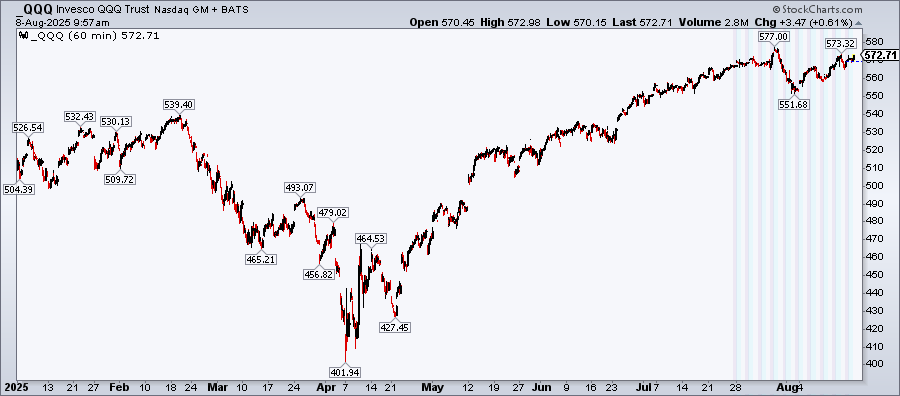
Here’s what to watch for: The Invesco QQQ ETF (QQQ) is hovering below its $577 all-time high. In the premarket and after-hours trading, I like to apply the Extended Hours toggle on SharpCharts, along with adjusting the period from daily to a more granular 1-minute view up to 195 min (2 bars/day). This way, I can better see performance trends beyond regular trading hours. It’s especially handy during earnings season when intersession moves can be material.
For now, traders should eye $577 in QQQ. A rally through there, led by AAPL, could lay the foundation for another leg in the rally off the April low.
QQQ With Extended Hours Pricing Applied: $577 All-Time High
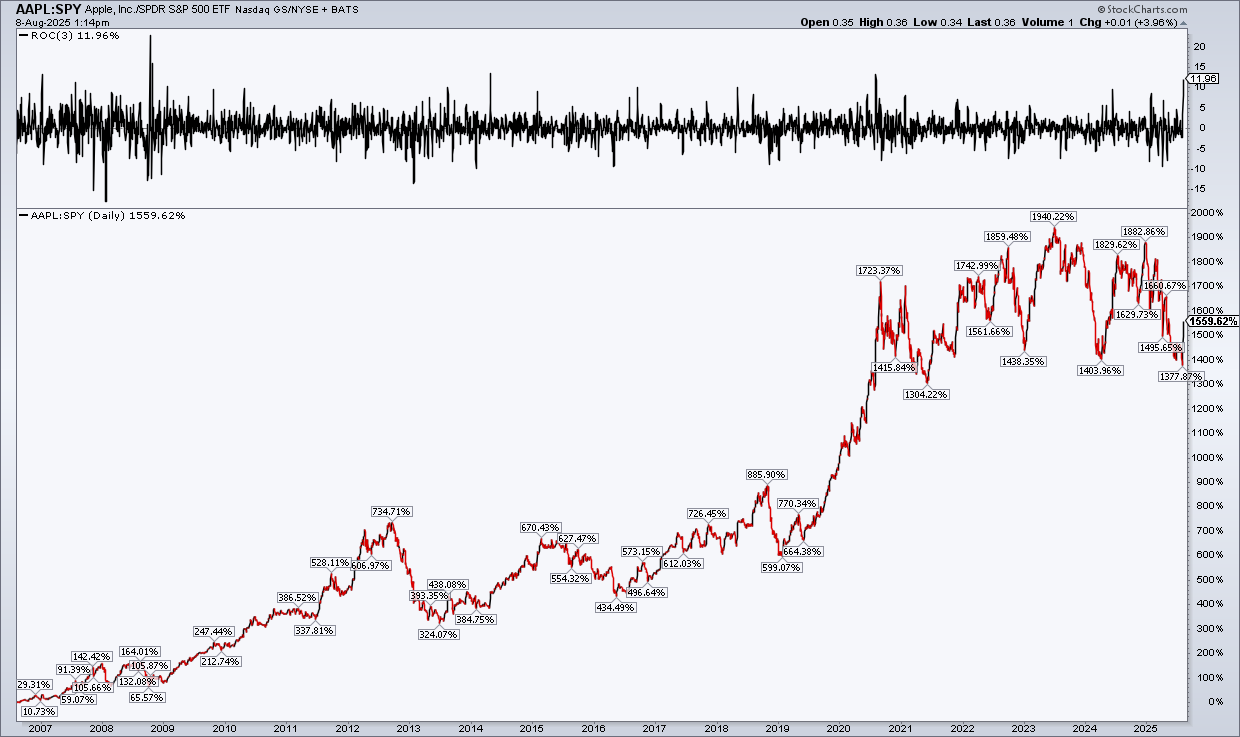
August 8 Afternoon Update: Shares are now up 13.1% over the past three days, with AAPL outperforming the S&P 500 by a whopping 12 percentage points in that span. With a strong close, the stock could have its best 3-day relative gain going back to 2008.
AAPL is now solidly above its 200-day SMA, putting the bulls in the driver's seat.
The Bottom Line
The bar was low for Apple coming into August. For months, Tim Cook’s company lagged not only the other Magnificent Seven stocks, but the S&P 500 as a whole. That could be changing now that we are through the bulk of Q2 earnings. Apple’s CEO cooked up a deal with President Trump, which is a fundamental game-changer. The chart, meanwhile, is clearing key technical hurdles.
Disclaimer: This blog is for educational purposes only and should not be construed as financial advice. The ideas and strategies should never be used without first assessing your own personal and financial situation, or without consulting a financial professional.


