US Dollar at a Crossroads, Gold Primed for Action: Macro Moves to Watch

Key Takeaways
- Key U.S. macro data is on tap this week, which likely means swings in the US dollar.
- Gold is also in play, with a technical pattern potentially coming to a head in the coming weeks.
- Revisiting intermarket principles, I game out outcomes between the USD and gold.
It's a busy week for the macro. We’ll get July CPI on Tuesday morning, PPI on Thursday, and Retail Sales on Friday. Tariff headlines should slow from last week’s non-stop pace, while we could see macro volatility flare up, given the US-China trade truce expiration on Tuesday and President Trump’s scheduled meeting with Russian President Putin on Friday.
With high-impact US data and geopolitical risks on tap, traders must assess the dollar.
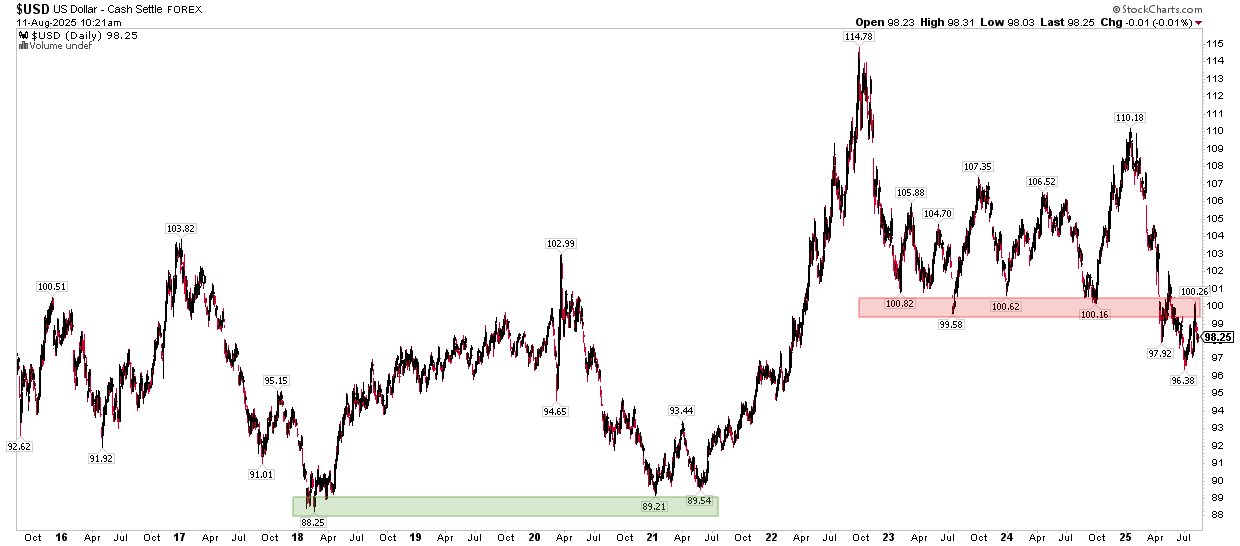
I constantly pull up the US Dollar Index (USD) on SharpCharts. Starting with the long view, notice in the 10-year zoom below that the greenback broke down under key support near the 100 level in Q2. We did see a corrective checkback toward the polarity zone throughout July, but the weak payrolls report put out on August 1 brought the dollar bears out of their brief hibernation.
But where does it go from here? On a multi-month basis, it would be totally normal to see the USD plunge another 10% to test the 88 to 90 range. That was the support area in early 2018 (near the 1-year mark of Trump 1.0), and where dollar buyers emerged during the first half of 2021. A rally through 101 would put momentum back in the bulls' corner.
US Dollar: Bucking Up Against 100 Resistance, Long-Term Support Near 90
With price levels gamed out, traders can look to classic intermarket analysis for how to position their portfolios through this macro lens. Classic intermarket asserts that in an inflationary environment, a lower dollar should correspond to higher commodity prices. Are we seeing that today? Well, kind of, sort of.
Gold is the obvious hard asset on the rise. Gold futures ticked to all-time highs last week on news that President Trump might apply tariffs to Swiss gold exports. We are still waiting for the White House to clarify that issue, and the precious metal (both spot and futures) edged lower to begin the new trading week. To be clear, spot gold remains far shy of its $3,500 per ounce record tagged in April.
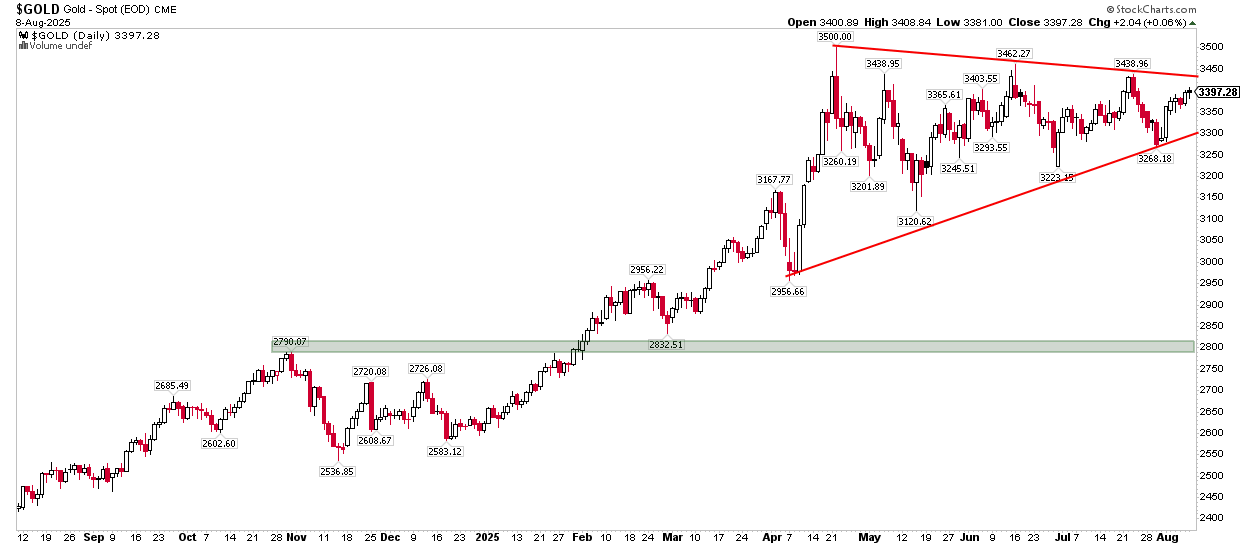
Technically, gold is in consolidation mode; the trend of lower highs and higher lows is a symmetrical triangle pattern. Traders should look for a breakout or breakdown from this coil for clues on the next big move. Based on the height at the onset of the consolidation, about $450, a rally through the triangle’s apex would portend a measured move price target to near $3,850. A bearish breakdown, however, would trigger a potential downside move to $2,850. These are rough targets to get a sense of the magnitude of the breakout/breakdown.
Let’s double-click on the bearish scenario (which, presumably, would coincide with better US economic data, no recession, and a jump in the dollar). The breakdown price objective has confluence with the polarity point from October 2024 and this past February, shaded in green on the chart below. I assert that a drop below the July low would be enough to bring that outcome into play.
For now, though, technicians should consider this series of lower highs and lower lows as a mere pause in the trend of larger degree, which is higher. Thus, a bullish stance is the default.
US Dollar Index: Symmetrical Triangle Targets $3,850 on the Upside, $2,850 on the Downside
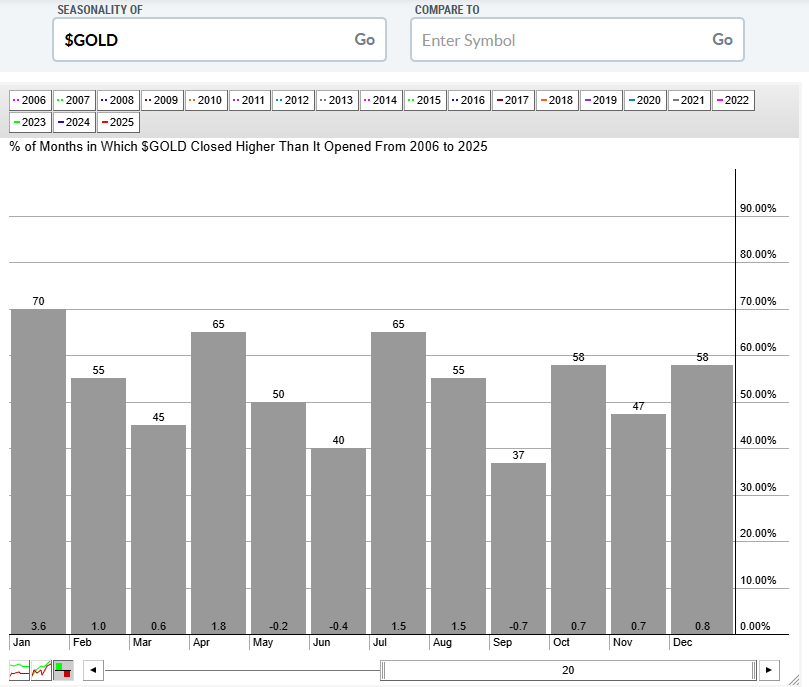
In a situation like this, with a potentially bifurcated outcome, I like to eye seasonal trends. To be clear, seasonality is a secondary indicator to price, so don’t treat it as the ultimate harbinger. Using the StocksCharts seasonality tool, gold has done well in August since 2006. The average return is 1.5% with a 55% positivity rate.
Unfortunately, September is among the weaker months, with a -0.7% mean return, higher in just seven of the past 19 Septembers. But fourth-quarter price action has been sanguine, with each month averaging a 0.7% to 0.8% gain (and continued strength through January, when gold tends to shine the most.
Fundamentally, macro-onlookers are surely keeping tabs on trends in central bank buying of the precious metal. Standard Chartered put out a note over the weekend calling out somewhat softer gold accumulation among monetary policy authorities last quarter. These tend to be price-insensitive buyers, so a breakout on the chart could actually spur fresh purchases amid ongoing geopolitical risks.
The Bottom Line
Keep your eye on the US Dollar Index this week. The greenback hovers under 100, and I see the potential for a 10% drop over the quarters ahead. Imagine the macro handwringing that would ensue in such a scenario. Intermarket analysis relationships in inflationary conditions dictate that commodities should outperform with a falling dollar. With oil stagnant, gold is the way to play it.


