A Rough Ride for Utilities
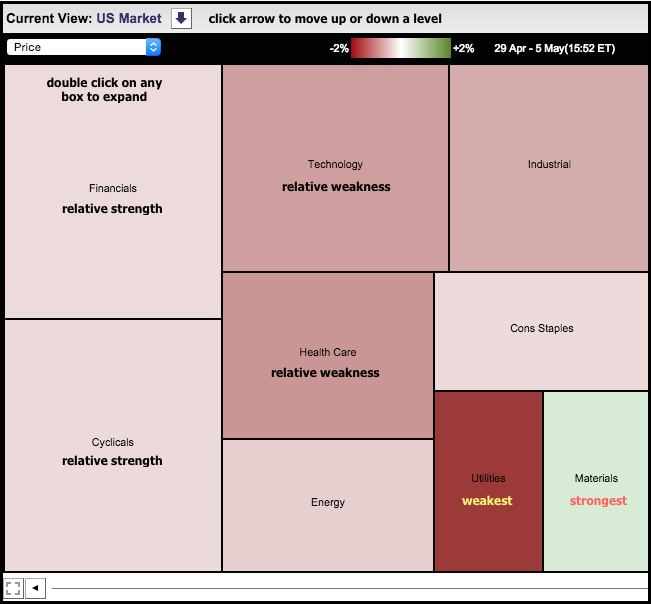
The chart below shows the Sector MarketCarpet over the last five days (29-Apr to 5-May) and utility stocks are the weakest. The average stock in the sector is down over 2% during this timeframe, which is why the box is dark red. Healthcare and technology stocks also came under selling pressure, but not as much as utilities. The average healthcare stock and average technology stock are down around 1%. Materials are holding up the best and this sector is the only one still in the green, which means the average stock in the sector still shows a gain, albeit a small gain.
Click this image for a live chart.

Click this image for a live chart.


