Ross Stores Stalls after Breakout

Ross Stores was hit hard with a high volume gap down in late May, but immediately firmed and recovered. The stock broke out of a long triangle in early June and then stalled with a small flag last week. Basically, we have two bullish continuation patterns at work.
The long-term trend is up because the 50-day EMA is above the 200-day EMA and the stock recorded a 52-week high last Monday.
With the long-term trend up, the long triangle consolidation is considered a bullish continuation pattern. The breakout, therefore, signals an end to this rest period and a resumption of the bigger uptrend.
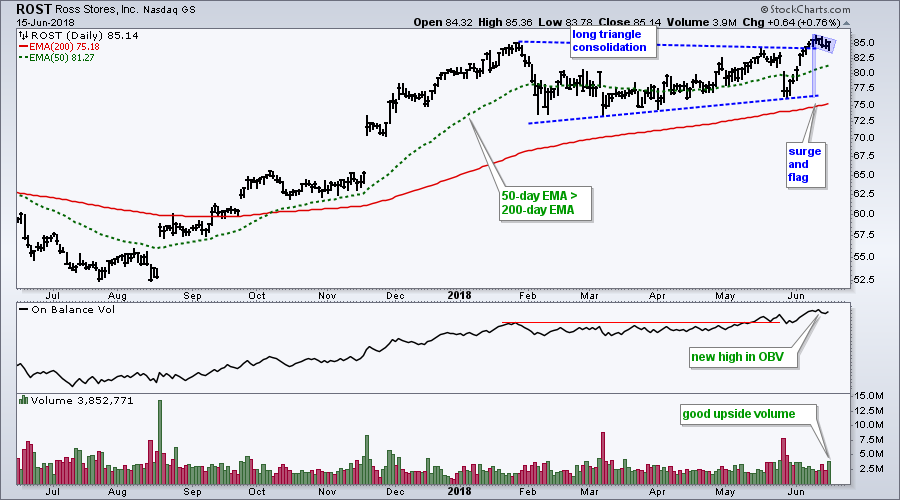
The breakout surge was over 10% and the stock corrected a little last week with a falling flag. These are short-term bullish continuation patterns and a breakout would open the door to new highs in the stock.
The indicator windows shows OBV hitting a new high in June as up volume outpaces downside volume. The new high in OBV is especially impressive after the high-volume gap down in late May. ROST recovered quickly by filling the gap with a steady advance.
- Arthur Hill, CMT
Senior Technical Analyst, StockCharts.com
Book: Define the Trend and Trade the Trend
Twitter: Follow @ArthurHill


