Is there a Biotech Breakout in the Making?
The Biotech SPDR (XBI) is trading at a make-or-break point as it consolidates near the 40-week SMA. Traders should watch for the resolution of this consolidation because it will dictate the next directional move.
The chart below shows XBI surging from the mid 60s to the lower 90s and then stalling with a small triangle. Technically, a small triangle is like a pennant, which is a bullish continuation pattern. A pennant breakout would signal a resumption of the prior advance and target a move to new highs.
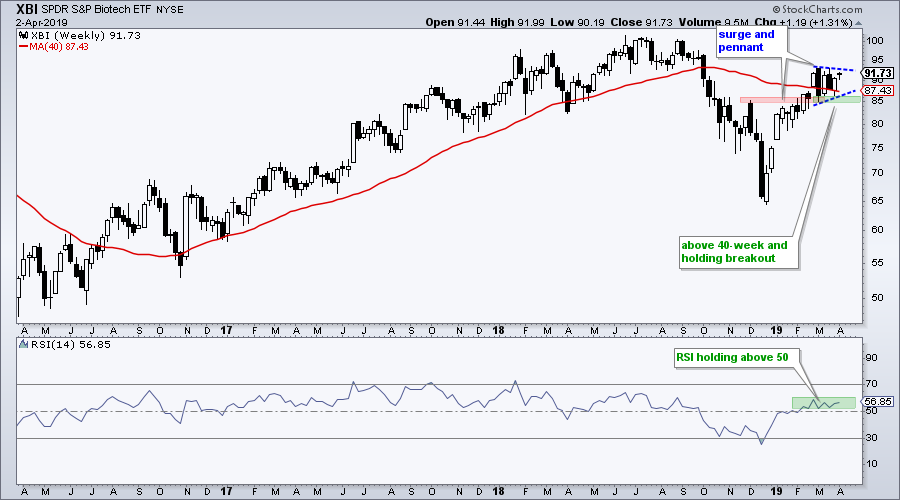
At this point, I have a bullish bias on XBI and expect a pennant breakout. Expectations, however, do not always go as expected so we need to consider the alternatives. The breakout zone turns into support in the 85 area. The ETF also bounced off the 85-87 zone two of the last four weeks with hollow (white) candlesticks. A break below this zone would be negative.
The indicator window shows weekly RSI (14) hovering above 50 to keep the momentum cup half full (bullish bias). A weekly close below 50 would signal a downturn in momentum and also be negative.
On Trend on YouTubeOn Trend on YouTube
Big Techs Lead as Banks Stall
- Industrials Sector and Key Stocks Break Out
- Click here to Watch
- Arthur Hill, CMT
Senior Technical Analyst, StockCharts.com
Book: Define the Trend and Trade the Trend
Twitter: Follow @ArthurHill


