BHGE Rapidly Improving and Ready to Jump
Here's a Relative Rotation Graph filled with stocks that I got off my StockCharts.com dashboard this morning:
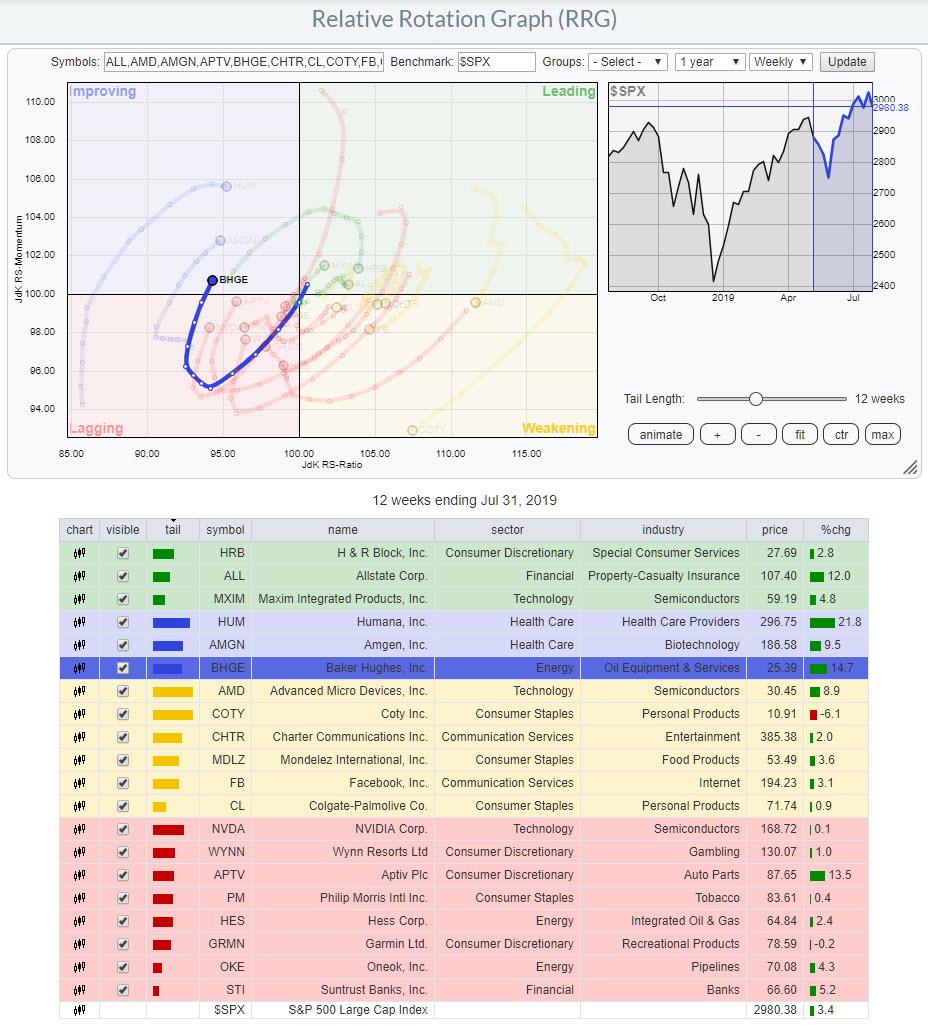
Your Dashboard is a great way to get an overview of what's going on in the market and organize your workflow on the site. If you are interested on how I found this groups of stocks, stay tuned for this weekend's ChartWatchers newsletter, in which I will explain how I populated this RRG.
The stock that I want to highlight from this RRG today is Baker Hughes (BHGE). On the weekly RRG, the stock's rotation has picked up nicely over the past five to six weeks, ever since the tail started to curl upward inside the lagging quadrant. BHGE is now entering the improving area while heading higher on both scales. That's reason enough to dig a little deeper and switch to a regular chart:
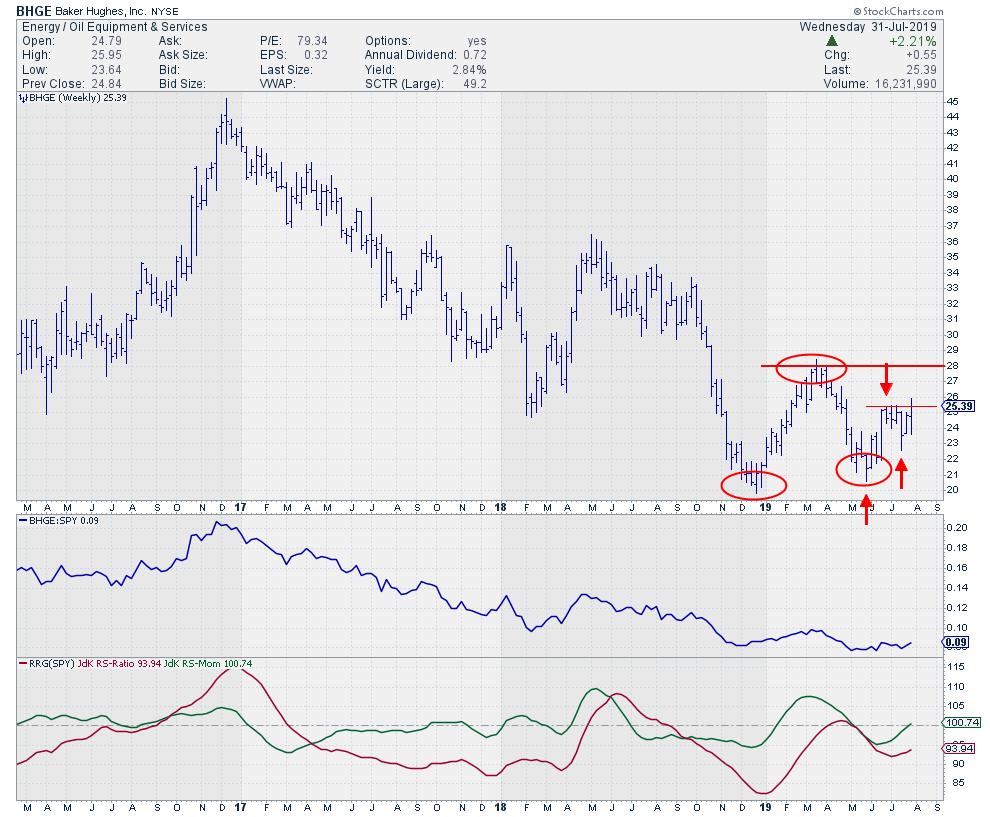
Since it's high in 2017, BHGE has traced out a predominantly falling trend, ending at a low in December 2018. The rally out of that low still fit within the falling trend as a recovery rally.
Things started to get a bit more interesting on 31 May, when there was a new low in at a higher level for the first time. These higher lows in a downtrend are the first signs that selling pressure is easing.
At the moment, BHGE is working its way higher to the last lower high (~$28.40) of that three-year downtrend. An upward break of that level will trigger the start of a new uptrend on the weekly chart.
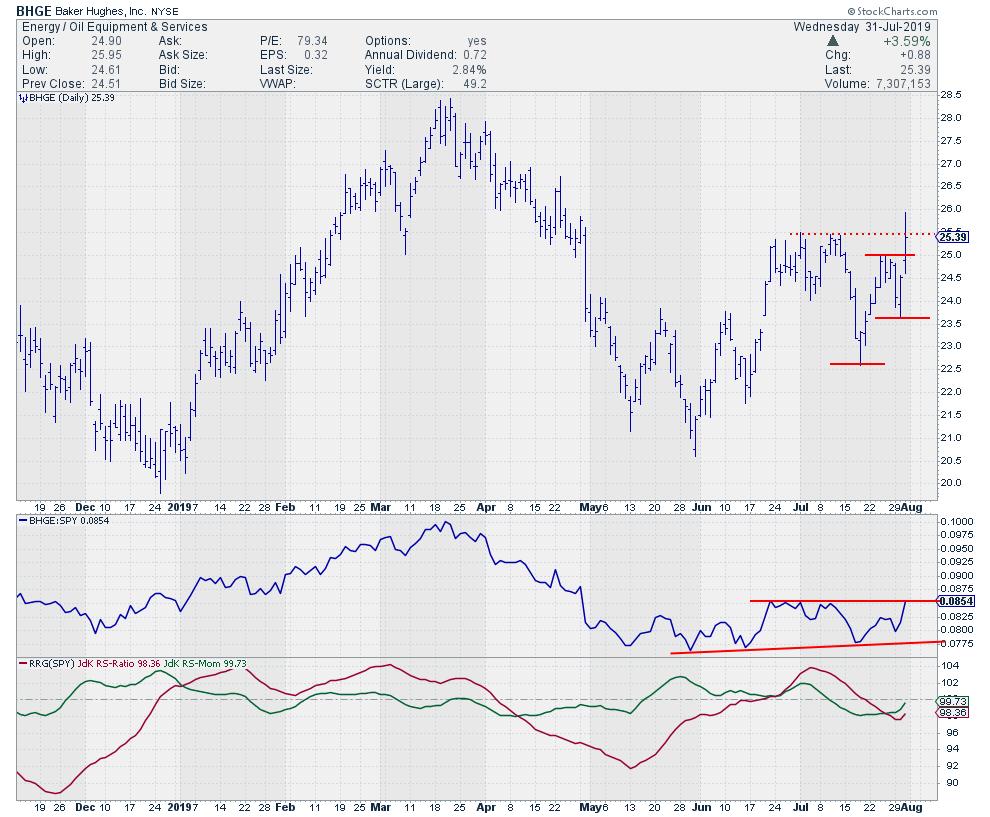
On the daily chart, a series of higher highs and higher lows is already emerging. Yesterday's price action has brought BHGE close to the break of an intermediate resistance level. Breaking $ 25.40 will confirm the positive outlook and free the way for a move towards that $28.40 level.
From a relative point of view, the relative downtrend has started to level off and is ready to turn around. With BHGE inside the improving quadrant on the weekly RRG and rapidly improving at a positive RRG-Heading (albeit while still inside the lagging quadrant) on the daily RRG, the outlook is strong.
Can any of you figure out what the criteria were to populate this RRG? Would love to hear from you.
My regular blog is the RRG Charts blog. If you would like to receive a notification when a new article is published there, simply "Subscribe" with your email address.
Julius de Kempenaer
Senior Technical Analyst, StockCharts.com
Creator, Relative Rotation Graphs
Founder, RRG Research
Want to stay up to date with the latest market insights from Julius?
– Follow @RRGResearchon Twitter
– Like RRG Researchon Facebook
– Follow RRG Researchon LinkedIn
– Subscribe to the RRG Chartsblog on StockCharts
Feedback, comments or questions are welcome at Juliusdk@stockcharts.com. I cannot promise to respond to each and every message, but I will certainly read them and, where reasonably possible, use the feedback and comments or answer questions.
To discuss RRG with me on S.C.A.N., tag me using the handleJulius_RRG.
RRG, Relative Rotation Graphs, JdK RS-Ratio, and JdK RS-Momentum are registered trademarks of RRG Research.


