Is This Stock Ready For a Turnaround - or Just a Quick Bounce?
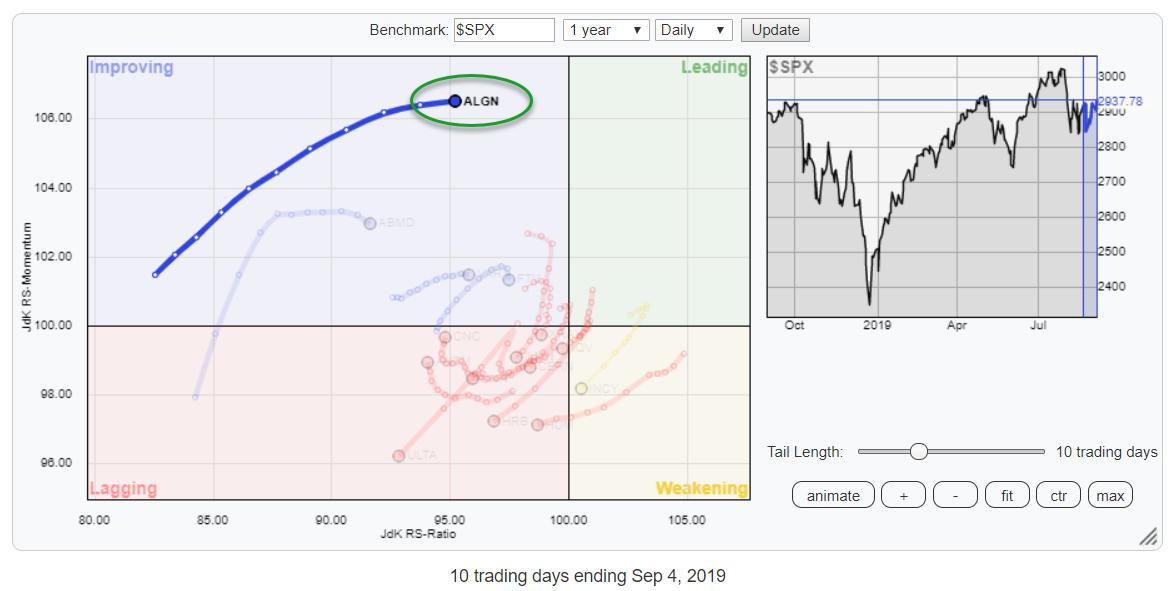
The Relative Rotation Graph (RRG) above is the result of a scan that I am running from time to time. Before you ask... ;) in an upcoming RRG Charts blog, I will explain how I got to this selection of stocks, including the scan-code.
For now, let's concentrate on the RRG and the stocks that are on display, especially the one that I have highlighted in the chart above: that long tail traveling northeast inside the improving quadrant belongs to ALGN, Align Technologies Inc.
As ALGN is a daily RRG, I am going to look at a daily chart to further investigate the stock.
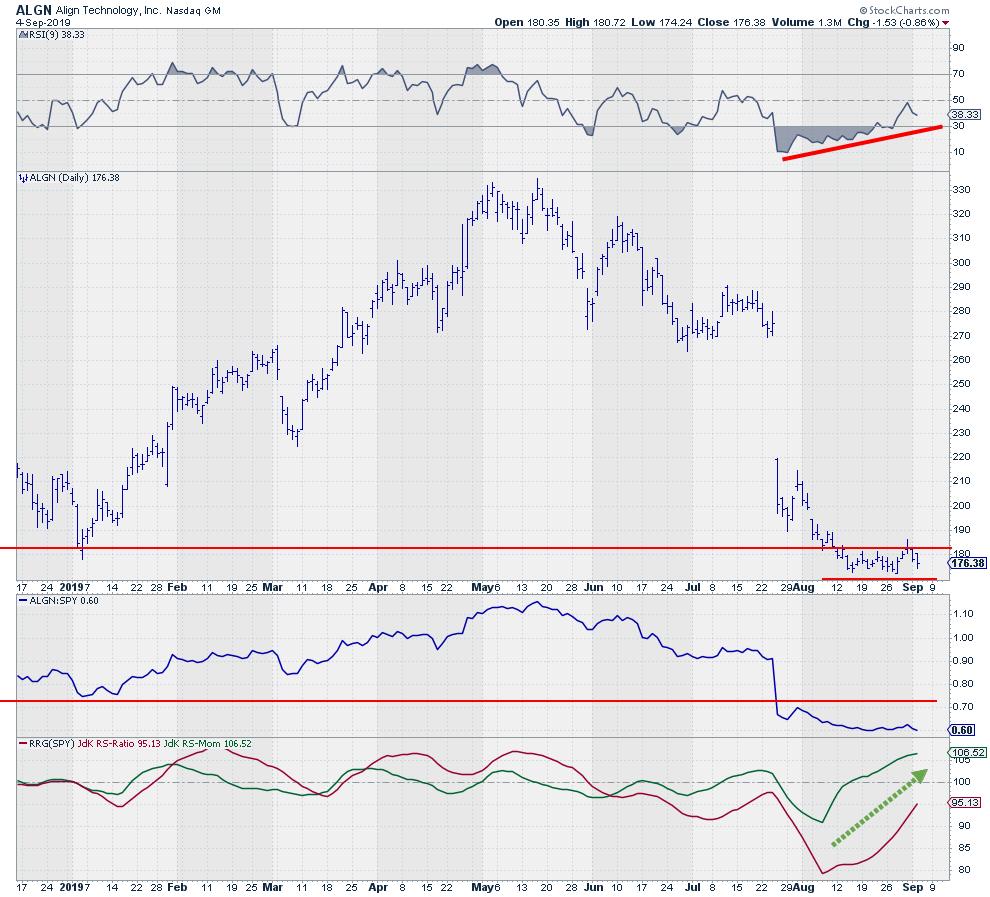
Clearly, this is a very weak stock, with the highs around $330 in May and a huge down-gap at the end of July. Since that sharp drop, the stock continued lower and even broke below the early 2019 low, which should have acted as support. (It did, but only for two weeks.) When that 2019 low did not act as support, the break of that support also did not accelerate the decline as expected, however.
Instead, ALGN has consolidated just below its breakout level, forming a small range that could easily become a nice bottom formation when the upper boundary of that small range (= former breakout level) can be taken out to the upside. The level we are looking for here is the range between $180-$185. The RSI(9) plotted above the price chart is showing a strong and increasing positive divergence with the price chart, which supports a scenario with prices moving higher and breaking out of that range.
From a relative perspective, the strong downward momentum on the RS-line has ebbed away over the past weeks, which is causing the JdK RS-Momentum to turn up and move higher. It is now followed by the RS-ratio line as well.
We are still pretty far away from a crossover to the leading quadrant, so a rotation back down remains an option. However, the combination of a potential bottom in the price chart, support by strong positive divergence in the RSI and a tail traveling northeast on the RRG makes this a stock worth keeping an eye on.
A Tradable Move
This could just be a bounce of support followed by a short, but tradable, rally. But it could also be the start of a turnaround of the longer term trend. Only time will tell. One thing is for sure - you are not buying at the highest level chasing a move higher.
Keeping stops close will be crucial in your money-/trade management for this one. Start with a stop nearby, assuming it will be a short bounce; then, widen/loosen once a new trend is established and we are indeed facing a nice turnaround.
My regular blog is the RRG Charts blog. If you would like to receive a notification when a new article is published there, simply "Subscribe" with your email address.
Julius de Kempenaer
Senior Technical Analyst, StockCharts.com
Creator, Relative Rotation Graphs
Founder, RRG Research
Want to stay up to date with the latest market insights from Julius?
– Follow @RRGResearchon Twitter
– Like RRG Researchon Facebook
– Follow RRG Researchon LinkedIn
– Subscribe to the RRG Chartsblog on StockCharts
Feedback, comments or questions are welcome at Juliusdk@stockcharts.com. I cannot promise to respond to each and every message, but I will certainly read them and, where reasonably possible, use the feedback and comments or answer questions.
To discuss RRG with me on S.C.A.N., tag me using the handleJulius_RRG.
RRG, Relative Rotation Graphs, JdK RS-Ratio, and JdK RS-Momentum are registered trademarks of RRG Research.


