Completed Pennant in XLF Points to $33 Area
On the Relative Rotation Graph for US sectors, Financials are in good shape. They are inside the leading quadrant and, despite a little loss of momentum in the last week, still at a good RRG-heading.
Together with Technology and Industrials, Financials is a leading sector at the moment.
A Pennant Formation
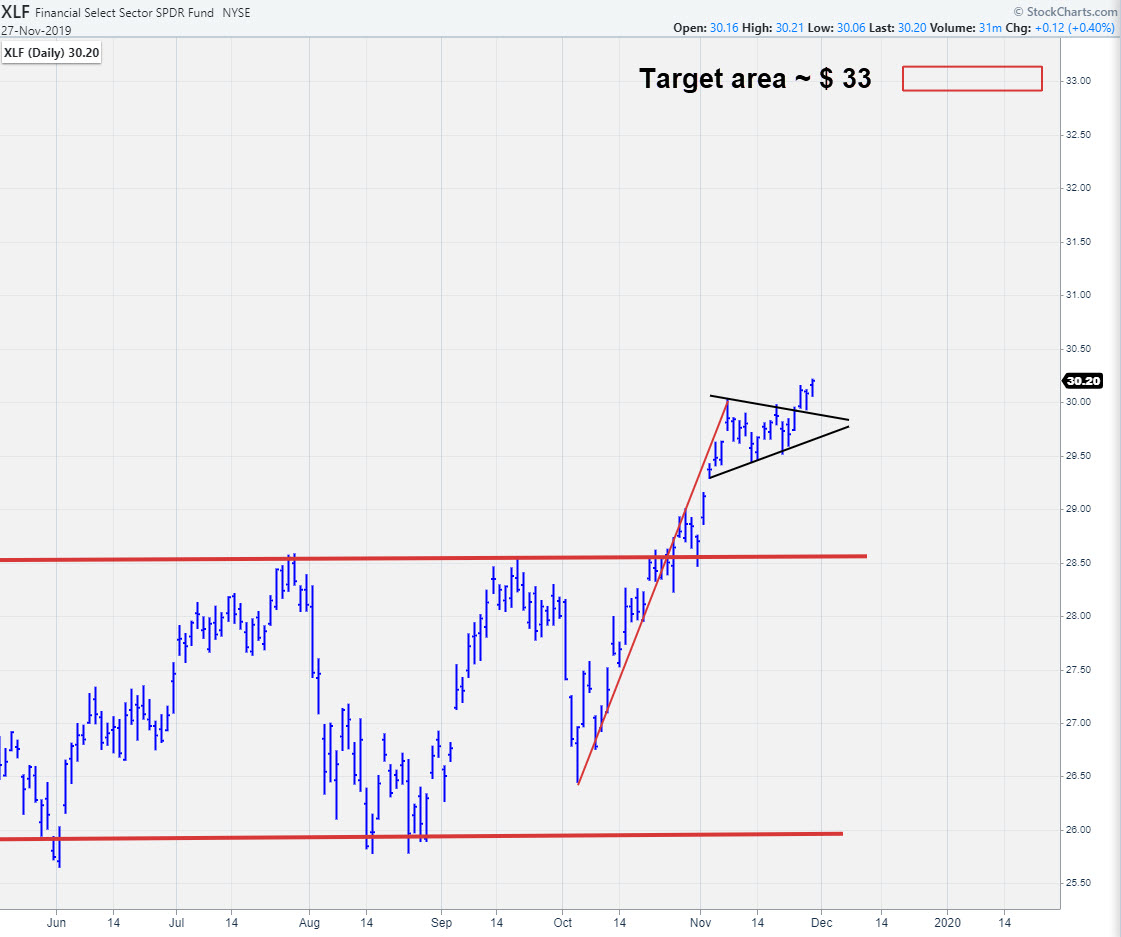
Opening up the daily price chart provides an interesting picture. After breaking out of the range between $25.50 - $28.50 that had been visible since April/May of this year, XLF started to accelerate. The rally that emerged out of the October low at $26.50 came to a rest on 7 November at a high of $30.03.
Subsequently, a pennant formation started to form; this small consolidation pattern was broken in an upward direction three days ago on 25 November.
You can read more on pennants and flags, their requirements and the implications for trading in this ChartSchool article.
With the prior rally and the flagpole measuring roughly $3, a price target for the continued move can be pegged in the area around $33. This comes from projecting the length of the prior move on top of the breakout level.
As you can see, I have used an ACP (Advanced Charting Platform) chart to illustrate this article. The main reason is that ACP enables me to easily adjust the scaling on the axes, especially the Y-axis. By using this function, I could annotate the chart with the extended move and illustrate the target area on the chart.
From the current level, there is still a meaningful move left for XLF to travel higher, while the downside is well-protected by old resistance levels now acting as support (first at $30).
-Julius
My regular blog is the RRG Chartsblog. If you would like to receive a notification when a new article is published there, simply "Subscribe" with your email address.
Julius de Kempenaer
Senior Technical Analyst, StockCharts.com
Creator, Relative Rotation Graphs
Founder, RRG Research
Want to stay up to date with the latest market insights from Julius?
– Follow @RRGResearchon Twitter
– Like RRG Researchon Facebook
– Follow RRG Researchon LinkedIn
– Subscribe to the RRG Chartsblog on StockCharts
Feedback, comments or questions are welcome at Juliusdk@stockcharts.com. I cannot promise to respond to each and every message, but I will certainly read them and, where reasonably possible, use the feedback and comments or answer questions.
To discuss RRG with me on S.C.A.N., tag me using the handleJulius_RRG.
RRG, Relative Rotation Graphs, JdK RS-Ratio, and JdK RS-Momentum are registered trademarks of RRG Research.


