+10% in the Last 30 Weeks, Outperforming SPY by 26% and Still Moving Further Into Leading Quadrant.
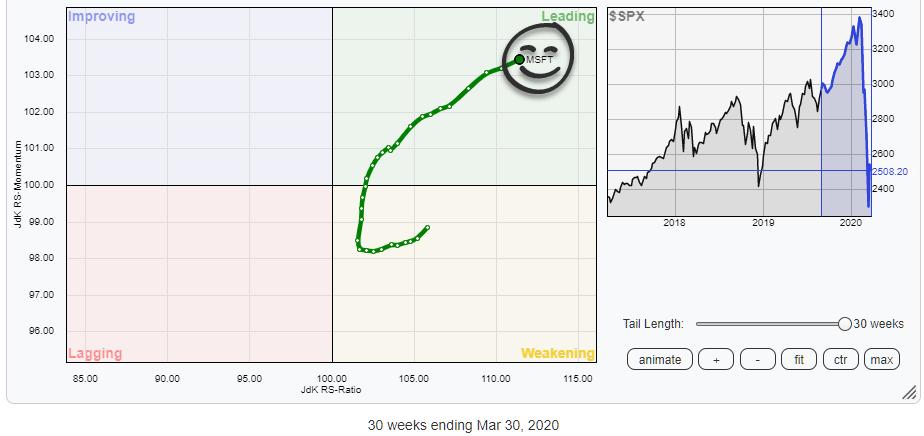
Tails that rotate from the leading quadrant into weakening and then back into leading always have my attention. The reason for that is that securities that rotate along such a path are already in a relative uptrend and the rotation from leading, through weakening, back into leading ,eams that another leg in that existing uptrend is underway.
The RRG above shows the tail of MSFT over the last 30-weeks. The rotational pattern is encouraging and the RRG-Heading suggests that the trend is still good and firing on both cylinders (=axes).
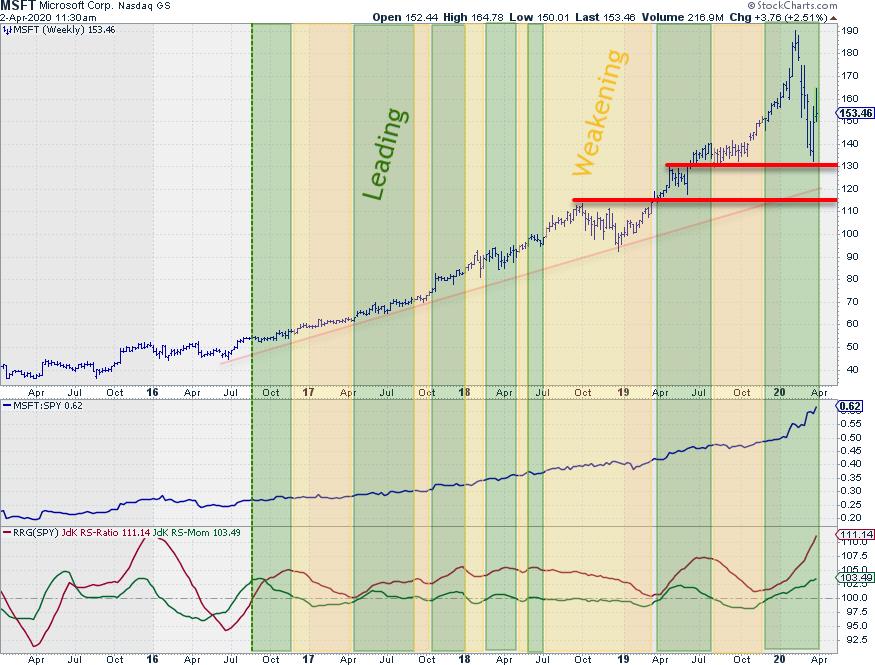
Looking at the weekly chart shows that this stock entered the leading quadrant in August 2016 and has stayed at the right side of the RRG ever since. The shaded green and yellow periods indicate time spent in leading and in weakening.
As you can see the latest rotation entered the leading quadrant again at the start of December.
The acceleration of the RS-Line when the market started to fall apart, including the stock price for MSFT, indicates the time when the men are separated from the boys.
From the high in February MSFT shows a loss in absolute terms but investors who bought MSFT in September 2019 (some 30-weeks ago) are still sitting on a 10% profit in absolute terms and an outperformance over SPY of 26%.
Loading the daily RRG version for MSFT vs SPY shows a tail that has rolled over inside the leading quadrant and is now heading lower towards weakening.
With the weekly tail this strong I will be monitoring the daily rotation until it's inside weakening and turning back into a 0-90 degree RRG-Heading.
When price will be able to hold up above support around $ 130 that could be an interesting entry setup.
#StaySafe
-- Julius
My regular blog is the RRG Chartsblog. If you would like to receive a notification when a new article is published there, simply "Subscribe" with your email address.
Julius de Kempenaer
Senior Technical Analyst, StockCharts.com
Creator, Relative Rotation Graphs
Founder, RRG Research
Want to stay up to date with the latest market insights from Julius?
– Follow @RRGResearchon Twitter
– Like RRG Researchon Facebook
– Follow RRG Researchon LinkedIn
– Subscribe to the RRG Chartsblog on StockCharts
Feedback, comments or questions are welcome at Juliusdk@stockcharts.com. I cannot promise to respond to each and every message, but I will certainly read them and, where reasonably possible, use the feedback and comments or answer questions.
To discuss RRG with me on S.C.A.N., tag me using the handleJulius_RRG.
RRG, Relative Rotation Graphs, JdK RS-Ratio, and JdK RS-Momentum are registered trademarks of RRG Research.


