Week Ahead: Keeping Head Above This Level Crucial for Nifty To Avoid Slipping Into Prolonged Weakness

Key Takeaways
- The Nifty closed its sixth consecutive week in decline, the longest losing streak in five years, with muted volatility and a lack of clear directional conviction.
- Immediate resistance lies at 24,500 and 24,850, with crucial support at 24,200 and 23,950.
- Relative Rotation Graphs provide sector rotation insights. Find out which sectors are leading, improving, and lagging.
The Nifty continued its corrective spell for the sixth straight week — a losing streak not seen in over five years — as the Index drifted lower through a relatively narrow range. The week saw Nifty oscillating in a 398-point range between 24,736 on the higher side and 24,337 on the lower side, reflecting muted volatility and lack of directional conviction. India VIX edged marginally higher by 0.48% to 12.03, indicating that sentiment remains calm despite the prolonged weakness. By the week’s close, the Index ended with a net loss of 202.05 points or (-0.82%).
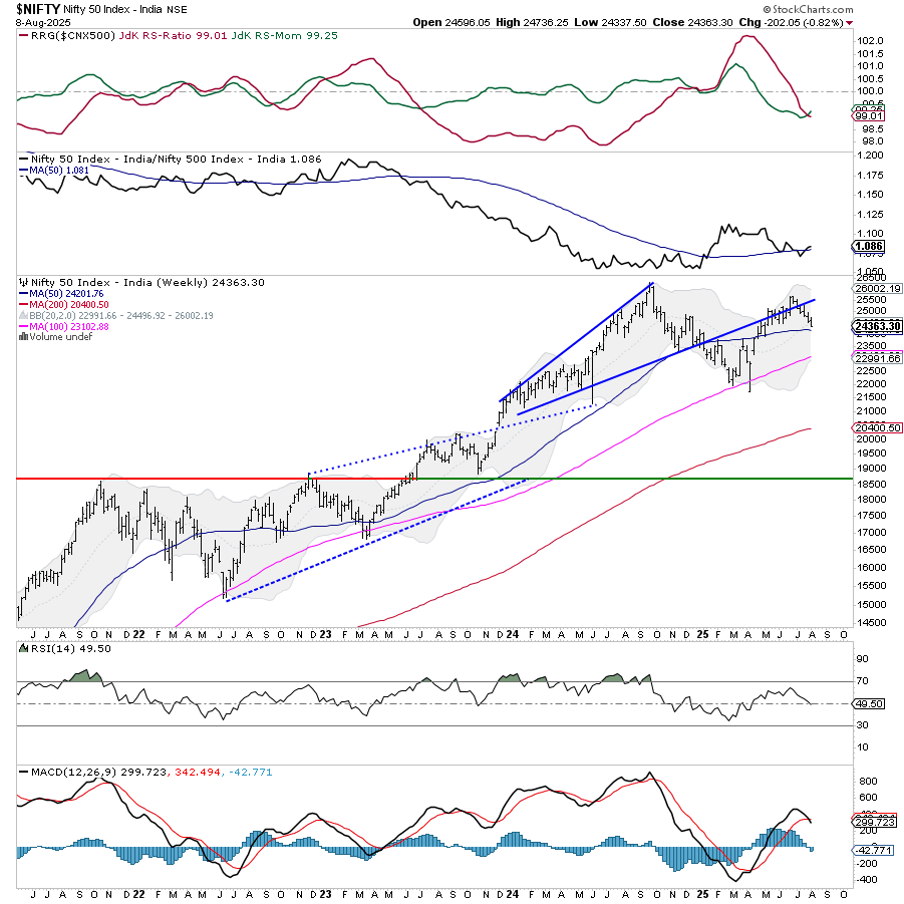
We have a short week with Friday as a trading holiday on account of Independence Day. The index structure remains weak in the near term. The recent peak near 25,650 marks a lower top, coinciding with a confluence of two important pattern resistances — one from a falling trendline drawn from earlier highs, and another from the upper boundary of a broad consolidation channel. This zone now acts as a strong supply area. The market is still trading beneath this resistance cluster, with a mild downward slope visible in short-term averages. Any meaningful upside would require a decisive breakout above this confluence; conversely, sustained trade below 24,200, which is a 50-week MA, could accelerate the corrective leg.
As we head into the new week, the Nifty is likely to see a soft or cautious start. Immediate resistance levels are placed at 24,500 and 24,850, while supports come in at 24,200 and 23,950.
The weekly Relative Strength Index (RSI) stands at 49.50. It has formed a new 14-period low, which is bearish, but it is neutral and without any divergence against price. The weekly Moving Average Convergence/Divergence (MACD) has shown a negative crossover; it is now bearish and trades below its signal line.
Pattern analysis reveals that the Nifty is still respecting the downward sloping resistance line from the previous top, which aligns with the lower-high formation near 25,650. The Index is hovering below the 20-week moving average (24,496), and any violation of the 50-week average at 24,203 could invite deeper cuts, making the Index incrementally weak from current levels. The inability to clear the confluence resistance despite multiple attempts highlights the prevailing supply pressure.
Given the current setup, traders should remain defensive in their approach. Fresh aggressive longs should be avoided until the Index breaks above the 25,000–25,100 zone on strong volumes. Short-term players may adopt a highly selective, stock-specific approach, with strict stop-losses to protect capital. For now, protecting gains and managing exposure prudently is the preferred strategy as the market continues to consolidate with a downward bias.
In our look at Relative Rotation GraphsⓇ, we compared various sectors against the CNX500 (NIFTY 500 Index), representing over 95% of the free-float market cap of all the listed stocks.
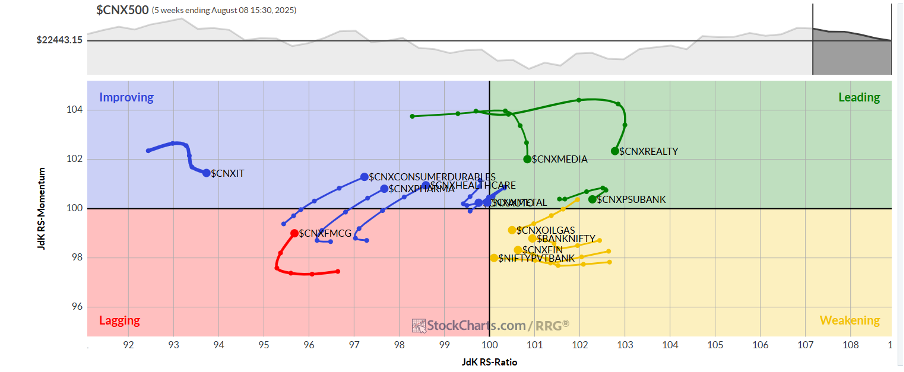
Relative Rotation Graphs (RRG) show that the Nifty Infrastructure Index has rolled once again inside the leading quadrant. Besides this, the PSE, Metal, Media, Realty, PSU Bank, Energy, and Midcap 100 Indices are also inside the leading quadrant, and may outperform the broader markets relatively.
The Financial Services Index and Banknifty are showing sharp improvement in their relative momentum while staying inside the weakening quadrant.
The Consumption and the Commodities Indices have rolled inside the lagging quadrant. The FMCG and the Services Sector Indices are also inside the lagging quadrant, but they are showing sharp improvement in their relative momentum against the broader markets.
The Nifty Pharma, IT, and the Auto Index remain inside the improving quadrant.
Important Note: RRG™ charts show the relative strength and momentum of a group of stocks. In the above chart, they show relative performance against NIFTY500 Index (Broader Markets) and should not be used directly as buy or sell signals.
Milan Vaishnav, CMT, MSTA
Consulting Technical Analyst


