Three Key Macro Charts I’m Watching on Vacation

Key Takeaways
- The S&P 500 likely remains in a bullish configuration as long as it holds the 6200 level.
- If less than 50% of S&P 500 members remain above their 200-day moving averages, that would confirm a bearish bias based on weakened breadth.
- Three of the Magnificent 7 stocks recently broke above key resistance levels. This market may just come down to whether these three stocks can hold the line.
My family and I are heading out next week for a family vacation to Ireland. I am super excited to take some time away, and enjoy some quality time with the family before back-to-school season is upon us. I’ll still be watching the markets, and will be sharing observations here and on my YouTube channel, but I’m dialing back on other content so I can relax and reflect a bit.
On the most recent mailbag episode of my daily market recap show, I was asked, “While you're out, what charts do you think we should pay the most attention to?” You see, my own investment process is built around a series of consistent routines every day, every week, and every month. But when I take a break, I like to lay out key levels and potential patterns ahead of time, so I can have a good framework for infrequent but still quite valuable market check-ins.
I can definitely see the bear case for stocks, based on some combination of excessively high valuations, weakening breadth conditions, and leadership rotation. But I also have to respect a market that remains in a very consistent uptrend phase! So here are three charts I shared today, along with the specific signals I’ll be watching for signs of weakness.
Will the S&P 500 Hold 6200?
The S&P 500 did not make a new all-time high this week, but it got very close to that threshold. Even though the index is excessively top-heavy at this particular moment, there’s no denying that the uptrend remains in good shape.
We’ll get back to those leading growth stocks a little later. At the end of the day, price is the most important thing to track. So let’s break down the S&P 500 chart in terms of key support and resistance levels to watch in the coming weeks.
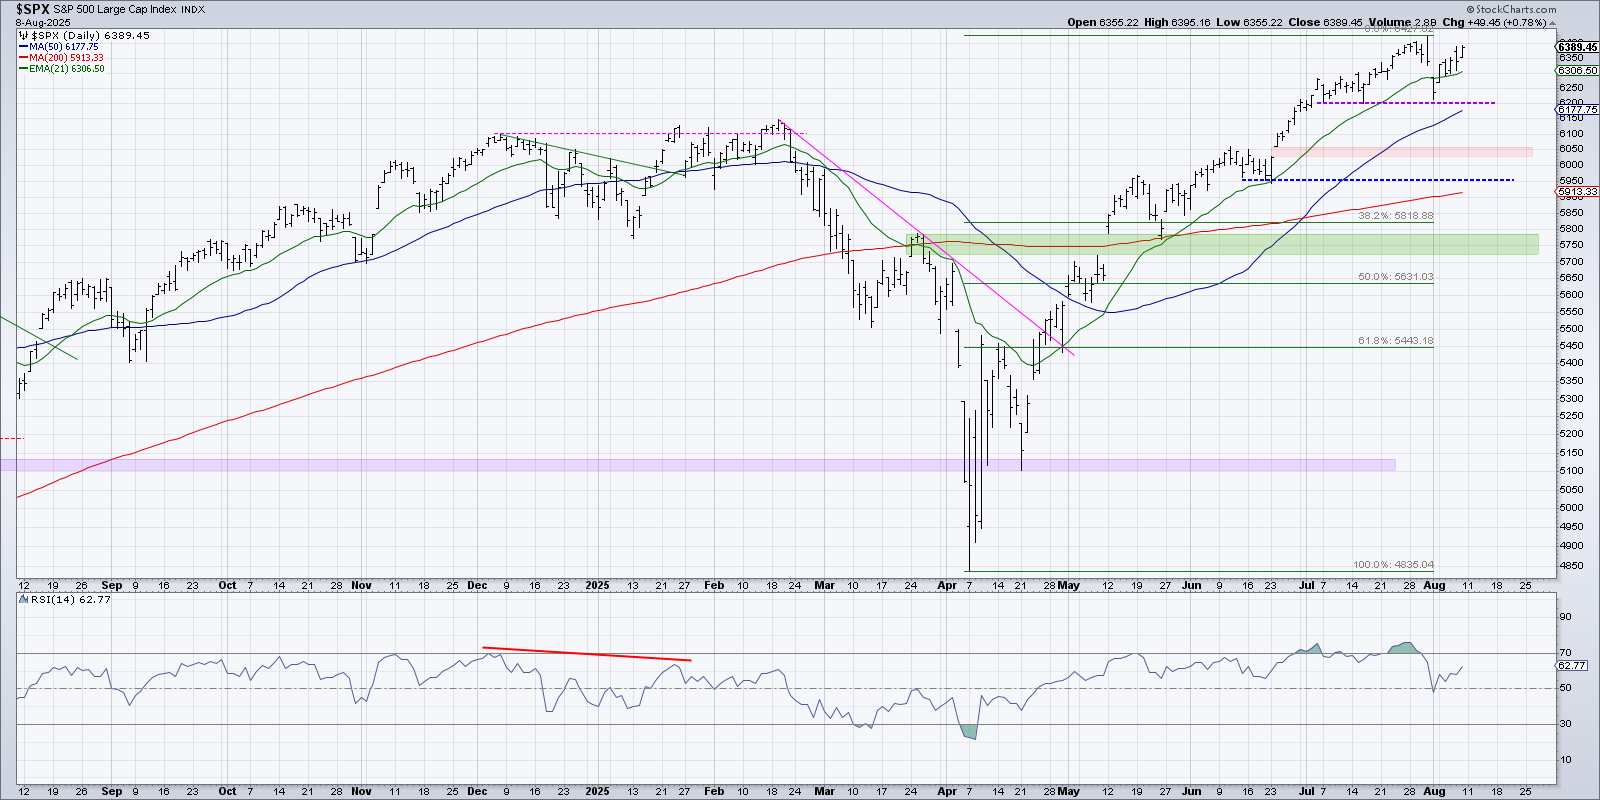
My initial “line in the sand” for the S&P 500 is the 6200 level, based on the July swing lows. We can see that this level also lines up with the 50-day moving average, which has been drifting steadily higher. As long as the SPX remains above this key pivot point, I’d be inclined to remain fairly bullish on stocks.
If that level were to fail, I’d expect the next potential support level around 5950, which would represent about a 7.5% drop from the S&P 500’s recent all-time high. I’d also be looking at momentum in that scenario, as a push below RSI 40 would serve to confirm a bearish phase. For now, though, that 6200 level is where I have a price alert set, as anything above that point is generally constructive.
Will Breadth Conditions Confirm a Breakdown?
Market breadth remains an essential part of my process, as it helps me to address the “top-heavy” nature of our equity benchmarks. When the market remains strong but the breadth indicators start to show weakness, that can suggest instability, as many individual stocks begin to diverge from the broad market performance.
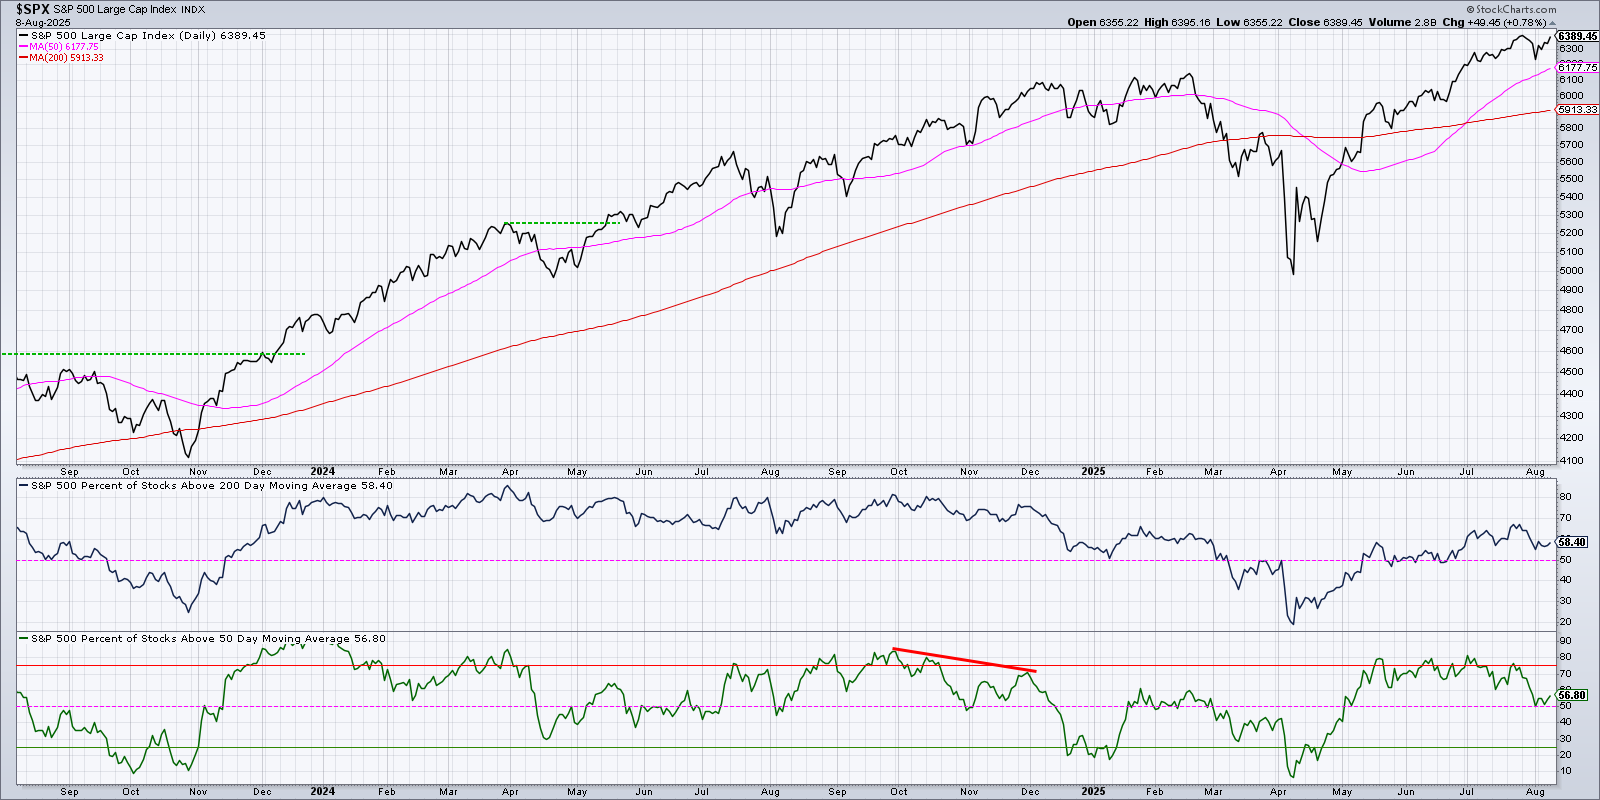
Here, we’re showing the percentage of S&P 500 members above their 50-day moving average, as well as the percentage sitting above their 200-day moving average. If the percentage of stocks above the 50-day would drop below 50%, that would suggest short-term weakness, given that more stocks are failing to hold this short-term support level.
Looking at the longer-term counterpart, we can see that about 58% of the S&P 500 members finished the week above their 200-day moving average. Now, if this indicator breaks below 50%, that would be a cause for greater concern. While the S&P 500 remains safely above its own 200-day moving average, a bearish rotation in this long-term breadth reading would indicate a high likelihood that the major equity averages would be dragged down even further.
Will Growth Leaders Hold Recent Breakout Levels?
Now that we’re winding down the most recent earnings season, I think it’s important to track whether top growth names continue their run of post-earnings strength. Three stocks in particular stand out for their recent breakouts: Meta Platforms (META), Microsoft (MSFT), and Apple (AAPL).
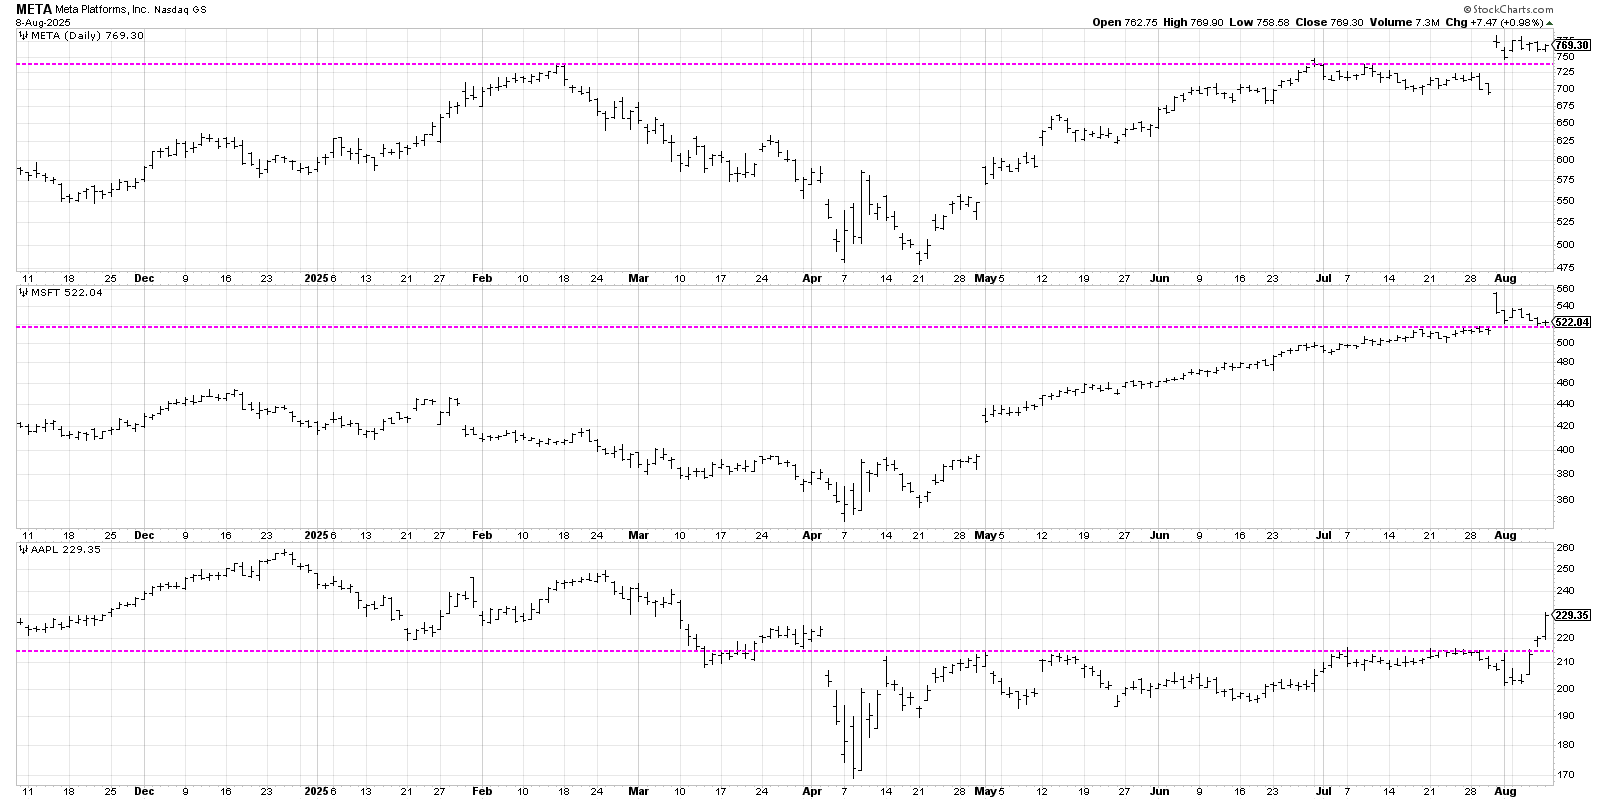
Both Meta and Microsoft broke to new all-time highs after their earnings releases last week, only to sell off after that initial gap higher. META finished the week just above its recent breakout level around $730, while MSFT pulled back all the way to its own previous resistance at $520. Now these are two solid companies that reported solid earnings results, but after the initial upside reaction the day after the release, both stocks immediately sold off.
Apple gapped higher mid-week after a White House announcement, and then continued to rally through Friday’s close. AAPL has now pushed well above the breakout level of $215, which had been a consistent resistance level since April. Apple has been one of the weaker Magnificent 7 stocks in recent months, remaining in a sideways trend since the initial rally off the April low. But with this week’s rally, the stock is once again in the discussion in terms of quality technical analysis configurations in the Mag7 names.
If these three stocks can remain above their recent breakout levels, holding that as support on any subsequent pullbacks, then I would assume that their strength is most likely going to keep the S&P 500 and Nasdaq 100 from experiencing too much pain. Once again, I’ve set price alerts for all three of these support levels, so that I don’t have to watch the charts too closely as I’m focusing on the family vacation!
Check out this video for more color on AAPL and the importance of that $215 level.
Also, if you have any suggestions on what I should check out on this trip to Dublin and Galway, please drop a comment on my latest video!
RR#6,
Dave
P.S. Ready to upgrade your investment process? Check out my free behavioral investing course!
David Keller, CMT
President and Chief Strategist
Sierra Alpha Research LLC
marketmisbehavior.com
https://www.youtube.com/c/MarketMisbehavior
Disclaimer: This blog is for educational purposes only and should not be construed as financial advice. The ideas and strategies should never be used without first assessing your own personal and financial situation, or without consulting a financial professional.
The author does not have a position in mentioned securities at the time of publication. Any opinions expressed herein are solely those of the author and do not in any way represent the views or opinions of any other person or entity.


