Before You Buy the Dip, Look at These 3 Charts
Key Takeaways
- The major indexes are in downtrends, with the S&P 500, Nasdaq, and Dow trading below their 200-day moving averages.
- Watch price action at key support levels before you decide to enter long positions.
- In a headline-driven, volatile market, charts help you stay focused, calm, and disciplined.
It’s tempting to look at a weak market and wonder if it’s time to buy the dip. Right now, however, the charts are telling you to be patient. The stock market still has a bearish tone, and even the pros are nervous.
Reviewing the charts in this ChartList, it's evident that this isn’t an ideal environment for chasing new long positions. At the moment, long-term investors are better off staying patient and letting the charts do the talking.
Narrow Strength, Rising Volatility
Among the S&P sectors, only Energy, Utilities, and Communication Services have a Bullish Percent Index (BPI) above 50%. This suggests that bullish strength is limited. On a relative basis, transports and semiconductors are holding up better than many other bellwether groups, but the broader market picture is still weak. Not surprisingly, volatility is picking up, with the Cboe Volatility Index ($VIX) moving closer to 30.
Outside the equity space, oil prices are moving higher, precious metals are falling, the 10-year Treasury yield rose to around 4.41%, and the U.S. dollar is strengthening against other major currencies. Put all this together, and you have a stock market that is under noticeable selling pressure.
There’s little sign that tensions over the Iran conflict are easing. And for as long as this uncertainty remains, stocks could continue to drift lower. It’s not the time for investors to pick up new long positions. Buying too early could feel like catching a falling knife.
In this environment, it’s important to keep a close eye on the charts, especially those of the major indexes.
S&P 500's Next Support
Let’s begin with the S&P 500 ($SPX). On Thursday, the index closed near the lower end of its trading range, which marked the sixth straight session where it closed below its 200-day simple moving average (SMA).
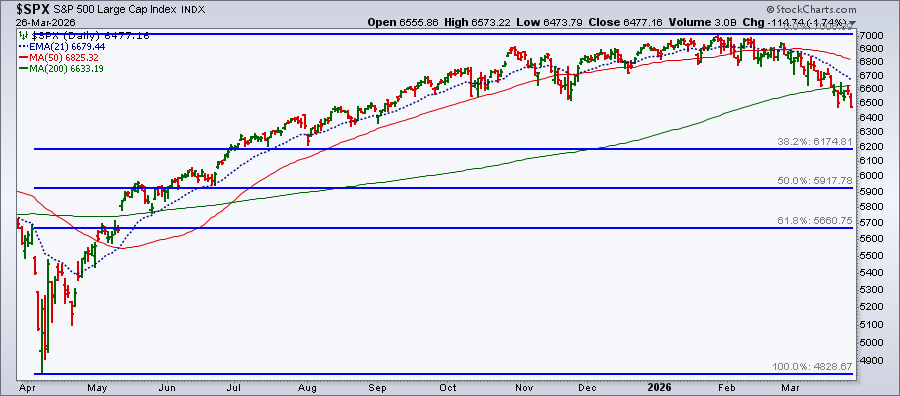
The next support level for the S&P 500 could be the 38.2% Fibonacci retracement level, which woudl be around 6174. You can easily monitor this using the Line Studies annotation tool.
Nasdaq Still Under Pressure
Now, let’s look at the Nasdaq Composite ($COMPQ), which is looking even weaker than the S&P 500.
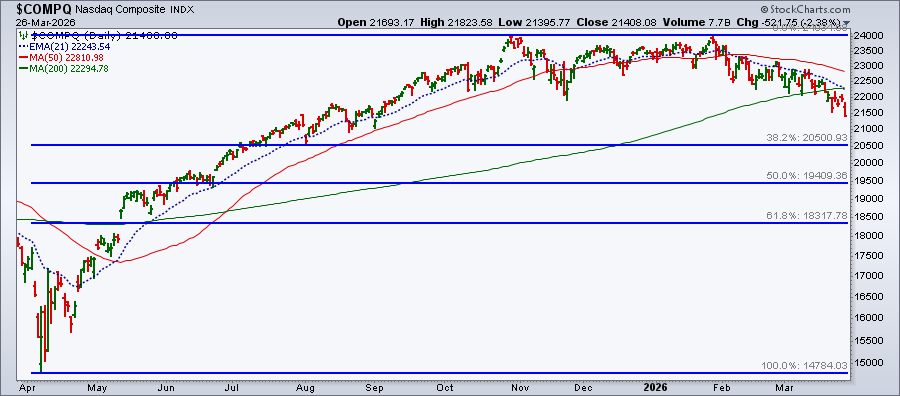
The downside pressure in the tech-heavy index is significant. The Nasdaq has closed below its 200-day SMA for seven consecutive days. The last time the Nasdaq was trading at this level was in early September 2025. So, where could it find support? Well, the 38.2% Fibonacci Retracement level is around 20,500, which is a logical area to monitor.
Dow's Following the Same Path
Finally, let’s turn to the Dow Jones Industrial Average ($INDU).
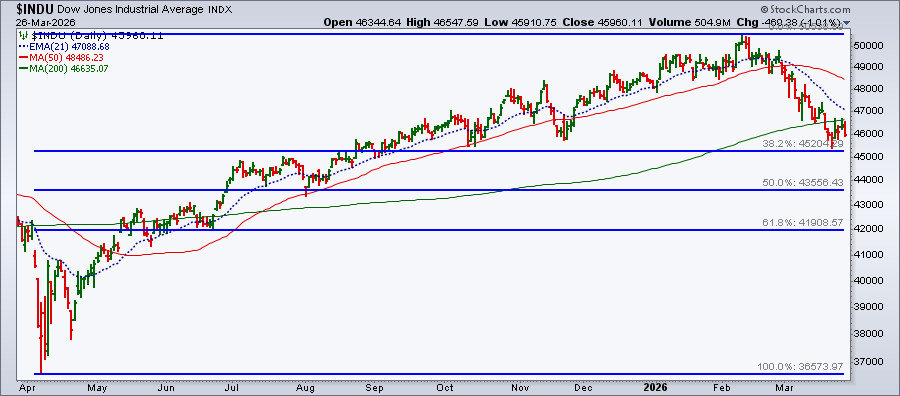
The Dow is showing a similar pattern. Like the S&P 500 and Nasdaq, it has fallen below its 200-day SMA and bounced off the 38.2% Fib retracement level. It's now moving back towards it.
Overall, the price structure of the three major indexes is a pretty straightforward story. Stocks are in a downtrend and buyers haven’t shown eagerness to shift the momentum. If there’s no sign of meaningful negotiations to end the Iran war, the selling could continue.
Friday had been marked as a deadline for the Iran-U.S. negotiations. But after Thursday’s market close, President Trump extended that deadline by another 10 days. Equity futures ticked up slightly on the news, but not enough to get traders excited. It’ll take a lot more to get traders to shift the momentum. Traders and investors need something more than a temporary headline boost to gain confidence about entering long positions.
Closing Bell
With the major indexes approaching their 38.2% Fib retracement level, the next few weeks could be important. Will those levels hold and trigger a bounce, or will the selling continue? In a headline-driven market, it all depends on the headline. That’s why it’s important to have your ChartLists. When those key levels are hit, you’ll recognize whether the bulls or bears are in control.
Disclaimer: This blog is for educational purposes only and should not be construed as financial advice. The ideas and strategies should never be used without first assessing your own personal and financial situation, or without consulting a financial professional.


