The Best Five Sectors This Week #55
Key Takeaways
- Leadership is unchanged at the top.
- Energy and Materials maintain strong relative uptrends.
- Utilities and Real Estate are improving; Tech, Financials, Comm Services, and Discretionary lag.
- Portfolios (CW & EW) are starting to catch up with SPY.
At the end of last week, the composition of the top five sectors remained unchanged. In the bottom half of the rankings, there was only one notable shift: Consumer Discretionary moved up from number 11 to number 10, while Financials slipped to the last position at number 11. Despite various market movements and weekend events, the sector positions have largely held steady as the new week begins.
This leaves us with this ranking:
- (1) Energy - XLE [11%]
- (2) Materials - XLB [7%]
- (3) Industrials - XLI [30%]
- (4) Consumer Staples - XLP [19%]
- (5) Health Care - XLV [33%]
- (6) Utilities - XLU
- (7) Real Estate - XLRE
- (8) Communication Services - XLC
- (9) Technology - XLK
- (11) Consumer Discretionary - XLY*
- (10) Financials - XLF*
Weekly RRG
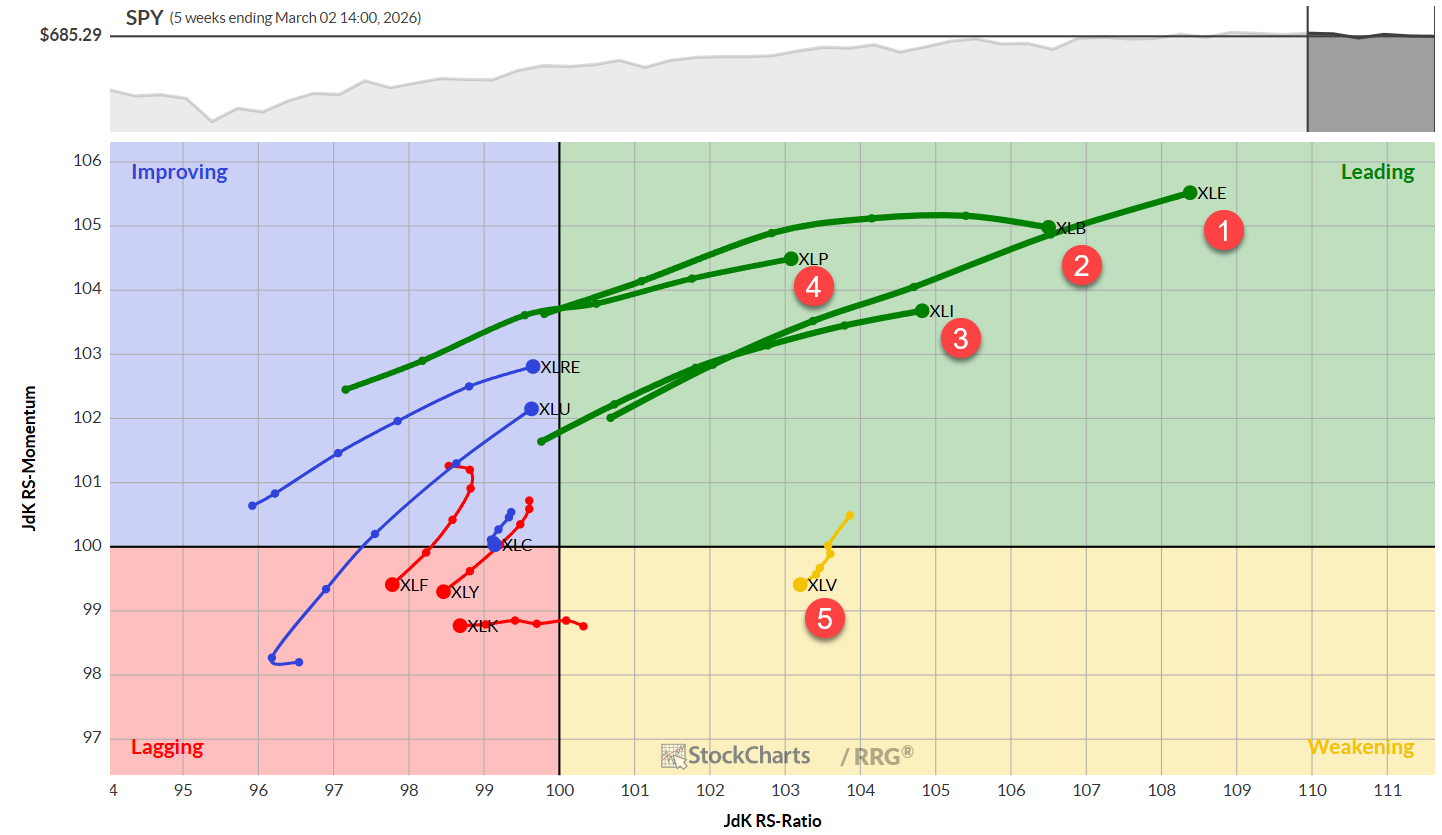
Examining the weekly Relative Rotation Graph (RRG), the first four sectors continue to show impressive strength:
- Energy: Leading by a significant margin, Energy sits deep in the leading quadrant with the highest RS momentum levels.
- Materials: Also firmly in the leading quadrant, though showing a slight dip in momentum.
- Industrials: Well inside the leading quadrant, Industrials are rising on both the ratio and RS momentum scales.
- Consumer Staples: This sector remains in the leading quadrant, climbing steadily on both axes.
The only top-five sector in the weakening quadrant is Health Care. Although it entered this quadrant a few weeks ago, Health Care is still holding up at relatively high RS ratio levels, leaving open the possibility for a rotation back into the leading group.
Weaker Rotations and Sector Movements
On the weaker side, Financials, Consumer Discretionary, and Technology are all in the lagging quadrant, trending lower on both scales. Communication Services is on the verge of crossing back into the lagging quadrant. Meanwhile, Real Estate and Utilities are showing strong moves, nearly crossing into the leading quadrant.
Daily RRG
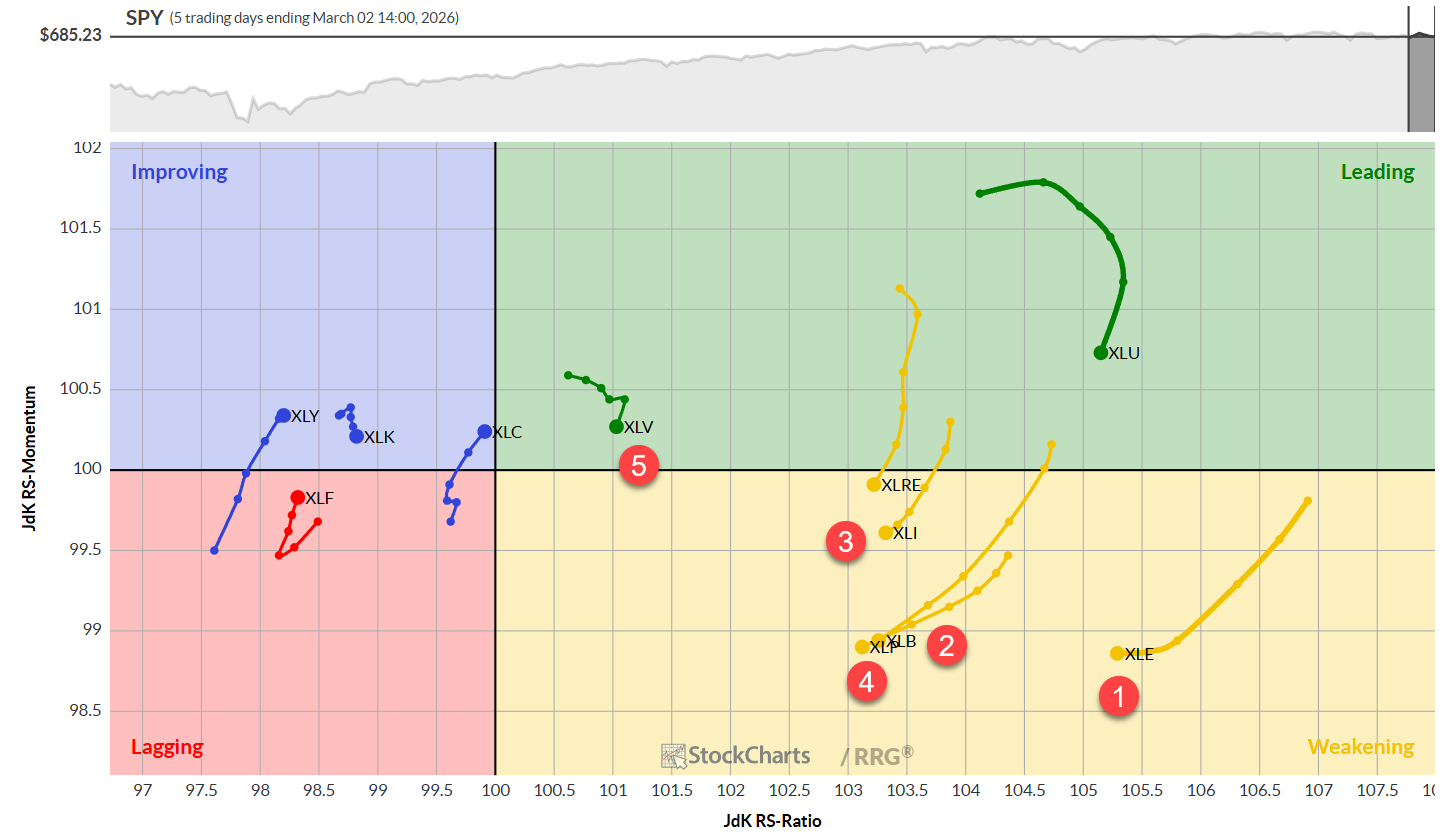
Zooming in on the daily RRG, all top-five sectors are experiencing corrective moves:
- Energy, Materials, Staples, and Industrials: These sectors are in the weakening quadrant but maintain high RS ratio values, suggesting a potential for rotation back to leadership, especially given the strong weekly RRG tails.
- Health Care: Currently in the leading quadrant but rolling over, confirming a loss of relative momentum on the weekly chart. This makes Health Care the most vulnerable among the top five.
Among the weaker sectors, Technology has already rolled over in the improving quadrant and is pointing back toward lagging, indicating a stable relative downtrend. Financials remain in the lagging quadrant but are attempting to move higher. Consumer Discretionary is in the improving quadrant but at the lowest RS ratio level, making it a vulnerable sector. Communication Services is close to the benchmark and may cross into the leading quadrant on the daily RRG, though this is not yet confirmed on the weekly chart.
Sector Highlights
Energy
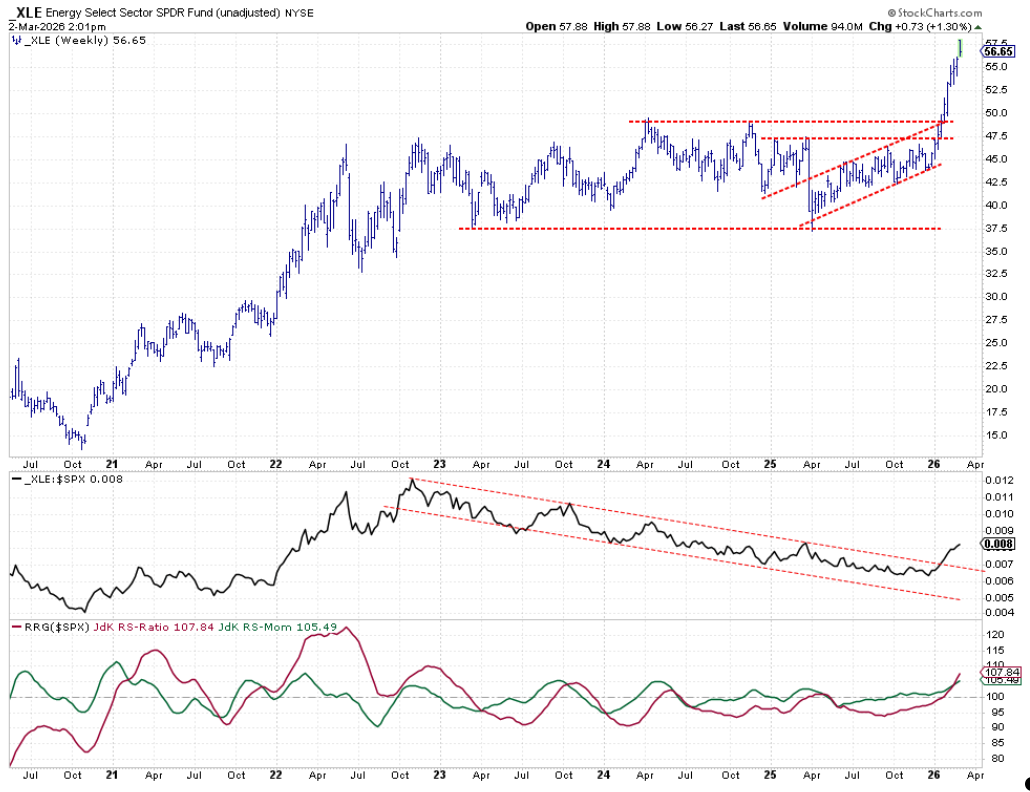
Energy continues to perform exceptionally well, pushing to new all-time highs. The relative strength line has broken out of its previous downtrend and is accelerating above the 100 level, driving both RRG lines higher.
Materials
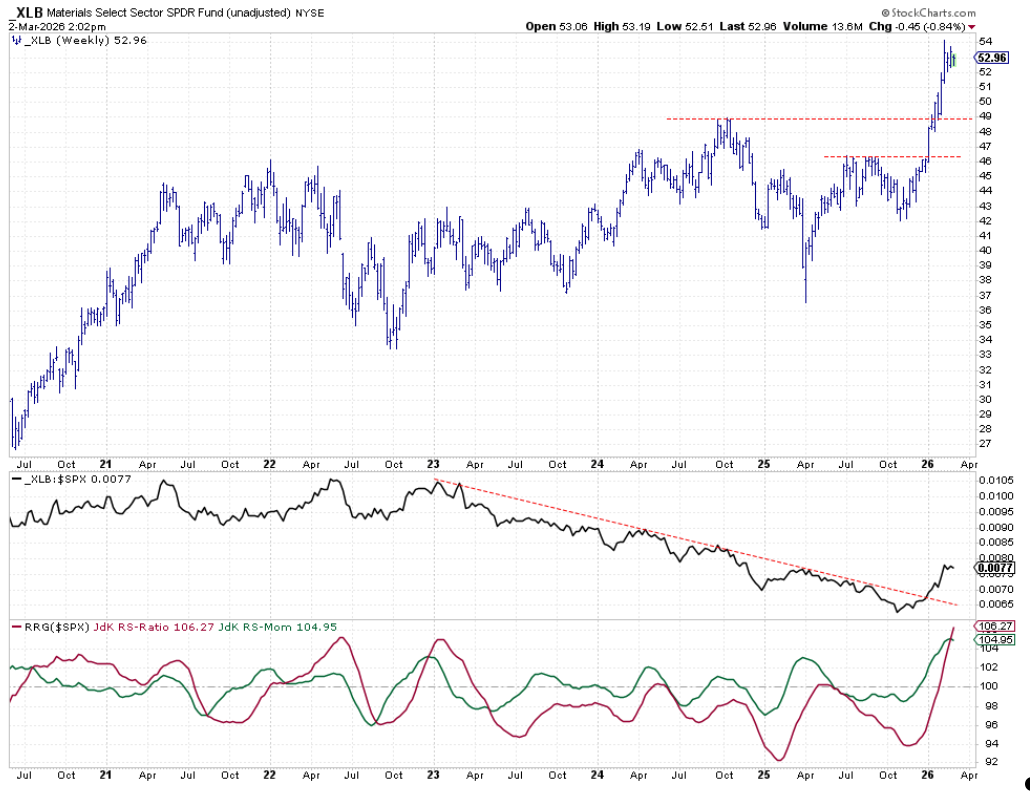
Materials have remained stable in recent weeks. The sector has not fallen back toward its breakout level, staying close to $53, with the previous resistance at $49 now acting as support. The risk of a downside move is decreasing as the market holds up, and the relative strength line remains strong after breaking a three-year downtrend.
Industrials
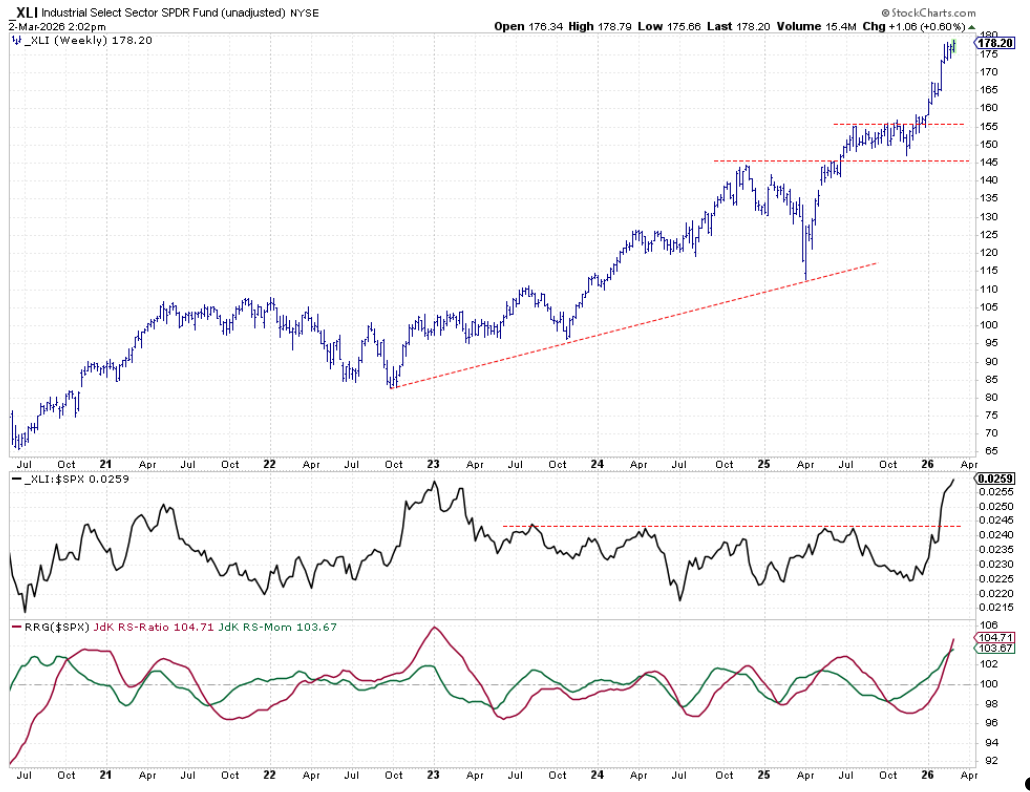
Industrials have also been stable for the past three to four weeks after breaking higher. The RS line is pushing toward a new high, matching levels seen at the end of 2022 and the start of 2023. Overall, the outlook for Industrials remains positive.
Consumer Staples
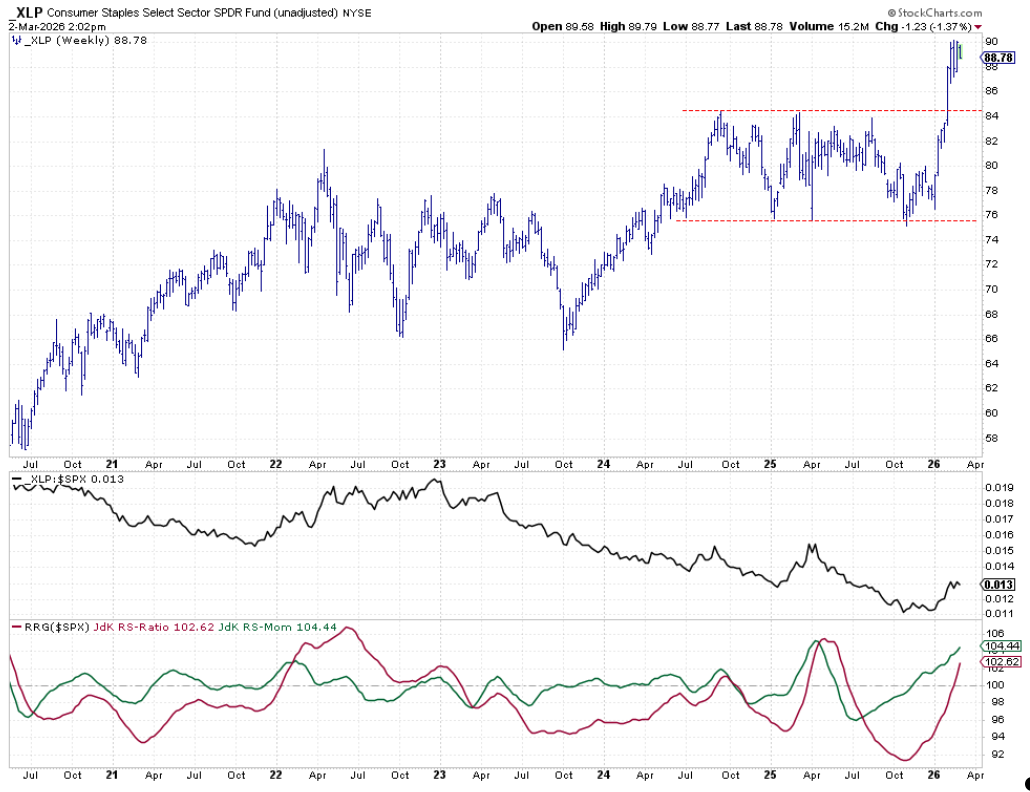
Consumer Staples show a similar pattern, consolidating around $88–$88.50 after a breakout five weeks ago. There is some room for a minor setback without damaging the positive trend. The RS line continues to rise, though a higher low would further confirm the uptrend.
Health Care
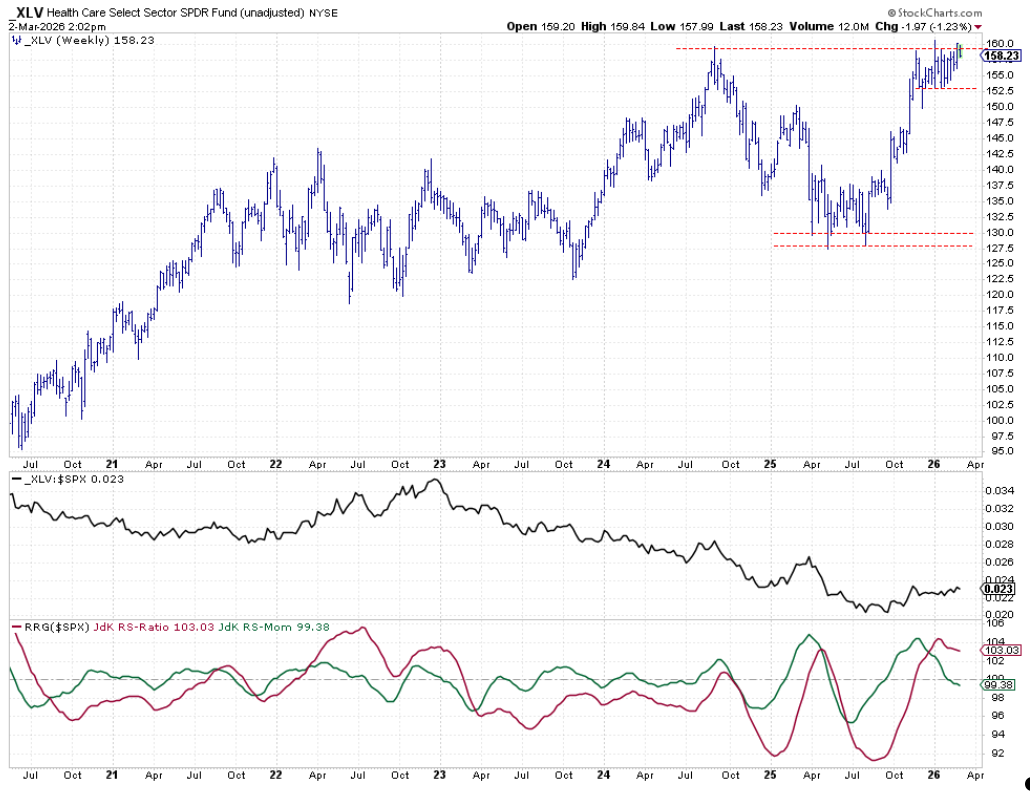
Health Care is struggling with overhead resistance of around $160. A break above this level could accelerate the rally in XLV and push the RS line above its previous high, confirming a new uptrend on a relative basis.
Portfolio Performance
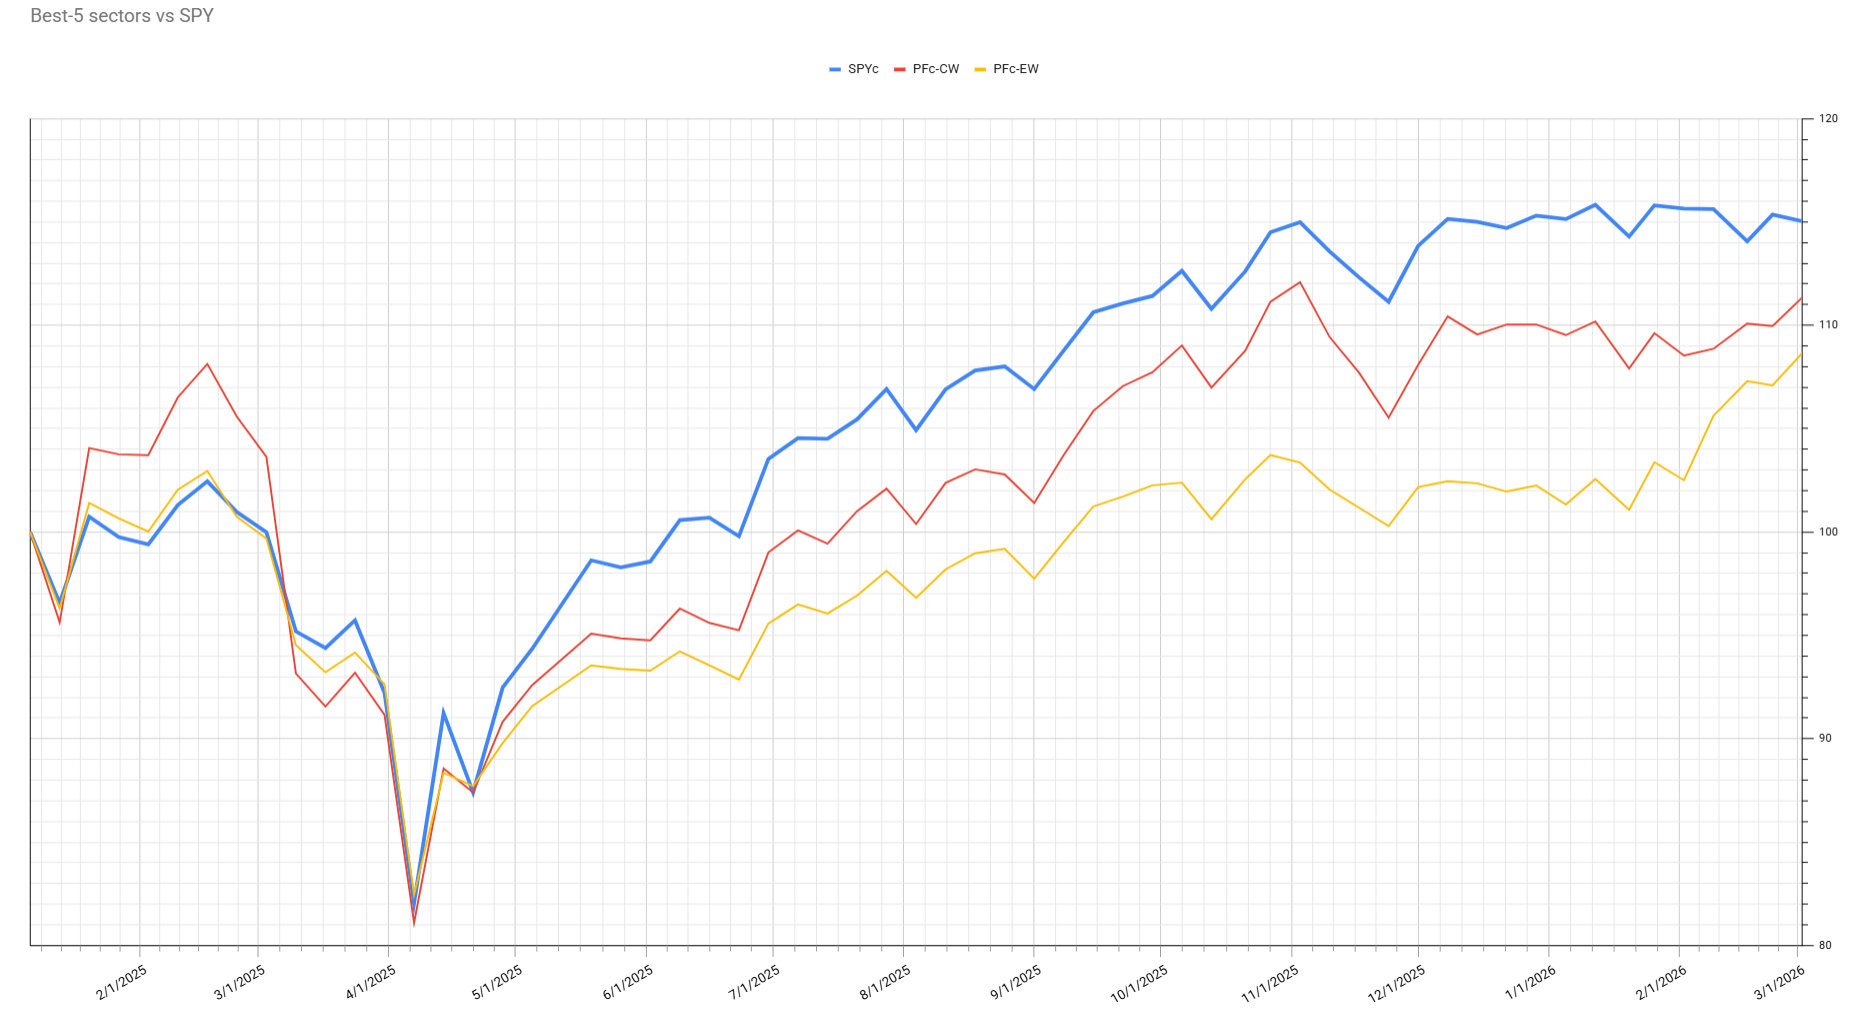
Last week was positive for both cap-weighted and equal-weighted portfolios, as both gained strength relative to SPY. While both portfolios are still lagging, the cap-weighted portfolio is now only 3.7% behind the S&P 500, and the equal-weighted portfolio has narrowed its margin to 6.4%. There is still progress to be made before overtaking the benchmark, but the recent gains are a promising start.
In summary, the sector landscape remains relatively stable, with Energy, Materials, Industrials, and Consumer Staples leading the way. Health Care faces some challenges but retains potential for recovery. The weaker sectors continue to struggle, but some are showing early signs of improvement. Portfolio performance is on the upswing, setting a positive tone for the weeks ahead.
#StayAlert, Julius