Broadening, Broadening Everywhere in Early 2026: Record-High Mid-Caps

Key Takeaways
- Strong participation lifts global equities as leadership rotates beyond mega-cap technology stocks
- Mid-caps break to record highs, signaling healthy market breadth and improving sector balance
- Early-year price action and technicals support a constructive outlook amid heavy data and earnings... and a SCOTUS tariff ruling
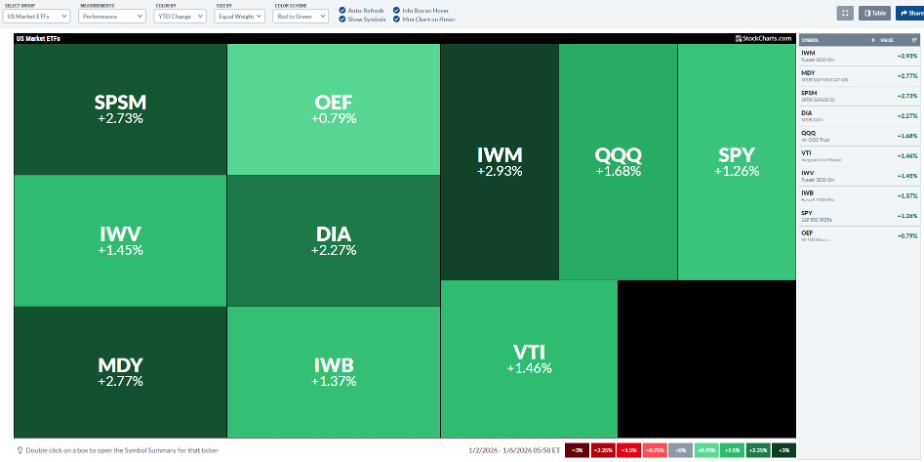
It's hard to keep up with all of the “broadening” trades that seem to break out one after another, just a handful of trading sessions into 2026.
The blue-chip Dow is on the verge of 50,000 (tallying its best start to a year this century), the S&P 500 Equal Weight ETF (RSP) prints records day after day, and international markets have recently left the Mag 7 in the dust.
The Market’s New Favorite Child: Mid-Caps
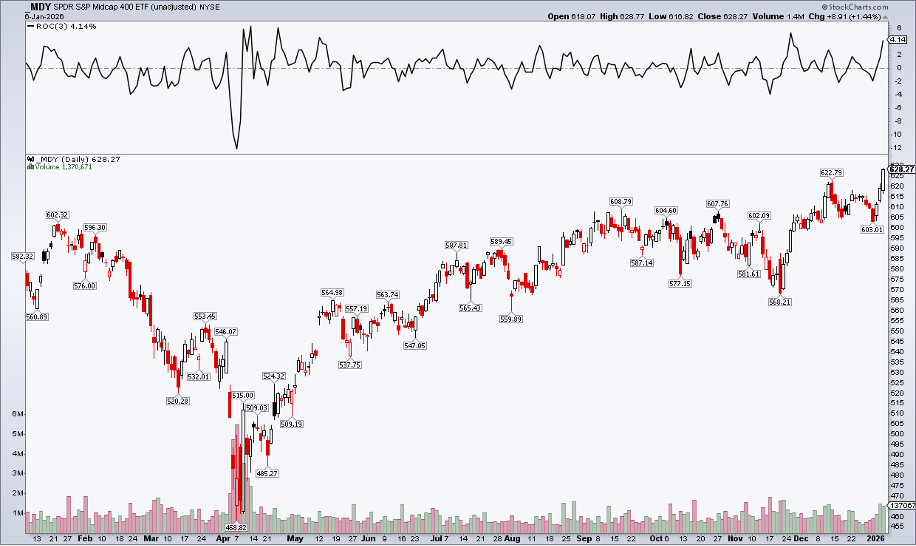
The latest apple of diversified investors’ eyes? Mid-caps. The SPDR S&P MidCap 400 ETF (MDY) is off to a rip-roaring start to the year.
On SharpCharts, my default setting is a one-year zoom, but to gauge YTD performance, I applied the Rate of Change (ROC) indicator, located at the bottom of the page. Plotting the number of trading days so far this year (three, as of this writing) above the chart, we see that MDY is already up more than 4% in January.
Early-Year Signals Are Flashing Green
Taking a step back to 2025’s close, the S&P 500 failed its attempt at a Santa Claus Rally, ending the period down less than a percentage point. But, in a sign of the broadening trade, many other indices, themes, and niche ETFs were easily positive from December 24 through January 5.
What’s more, data reveal that the “first five days” indicator (the January 2–8 stretch this year) actually matters more to the full-year outcome. Barring a dramatic two-day bearish reversal ahead of Friday’s nonfarm payrolls report, the bulls will check that box.
Why Mid-Caps Matter in a Broadening Market
Any way you slice it, the average global stock stormed out of the gates. But why is MDY so important?
First, like many non–large-cap products, it’s effectively equally-weighted. The top 10 holdings of MDY account for just 7.7% of the portfolio, and no single stock is heavier than a 1.08% position.
Additionally, it’s a more balanced sector mix. Industrials, a cyclical-value area, make up 22% of the product, with the growth-heavy Information Technology sector accounting for 16% of MDY (compared to the S&P 500 ETF’s (SPY) 35% tech stake). Financials and Consumer Discretionary, at 16% and 12%, respectively, are the next-largest weights.
The upshot: When mid-caps break out, a lot must be going right across the entire U.S. equity universe.
Reading the Chart as Data and Earnings Loom
But what does the chart actually say as we head into a key stretch of official economic data and Q4 corporate earnings? Let’s peel back the chart to the pre-pandemic period to get a sense of just how far the Jan Bradys of the equity world (h/t JC Parets) have come.
A Breakout — But Not a Perfect One
Notice in the chart below that MDY finally eclipsed its November 2024 peak with its $628.27 settle this past Tuesday. The question is: Was that a definitive breakout? It looks good, but not perfect.
Here’s why: First, the RSI momentum oscillator at the top of the chart printed 66—I’d like to see that rise above 70 to help confirm the breakout. As an aside, I prefer to use the RSI as a confirmation tool rather than a black-and-white signal of overbought or oversold. After all, is it really a bad thing if there is so much buying demand that it makes a security “overbought”?
Second, volume was also good, not great. Monday’s and Tuesday’s sessions certainly featured more shares traded compared to the holiday period, but it didn’t appear to be an explosive two-day showing.
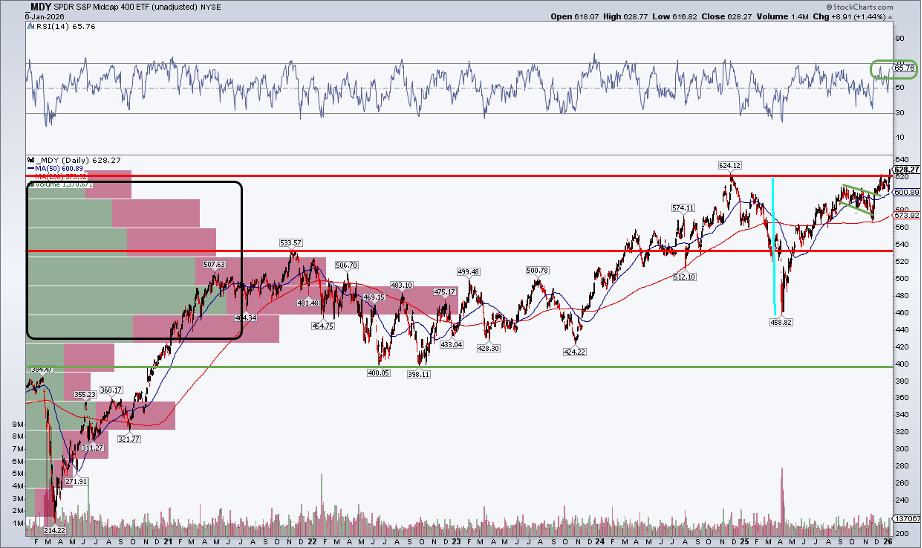
Support Looks Solid Beneath the Surface
Nevertheless, the record-high price means there’s no resistance above today’s level. Moreover, with a high amount of volume by price below $625, there should be ample support if we see a consolidation or pullback as the reporting season gets underway. Also encouraging is the bull flag pattern that played out from mid-September through Thanksgiving.
The bulls took a Q4 breather, but the mid-cap bears were unable to push MDY below its then-flat long-term 200-day moving average. Today, the 200-dma is back on the rise, suggesting the bulls control the primary trend.
A Familiar Pattern from the Post-Pandemic Era
Zooming out, we saw a similar consolidation off the March 2020 bottom from mid-2021 through early 2024. That resolved higher, and I expect this year’s breakout to do the same. Given the decline from $624 to $459 and the presumed breakout, we can calculate a measured-move upside price objective of $789. We get that by adding the $189 range onto the breakout level.
So we’re talking about another 26% of upside — very doable in a single year.
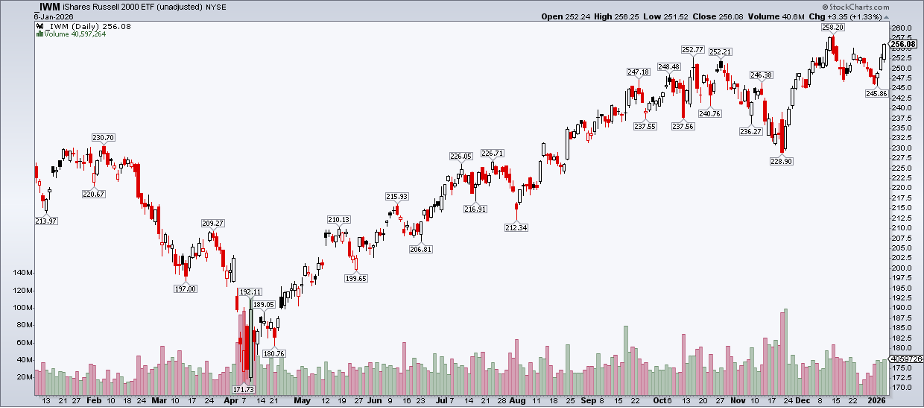
Breakouts Don’t Always Move in Straight Lines
Index breakouts are rarely so clean, though. The iShares Russell 2000 ETF (IWM) is a case in point. That fund notched a record on October 15, only to fall to $229 five weeks later. It has since scaled back up into the mid-$250s, but it has been two steps up, one step back over the past three months — a reminder that volatility (even fear) may persist even when price action is generally healthy.
The Bottom Line
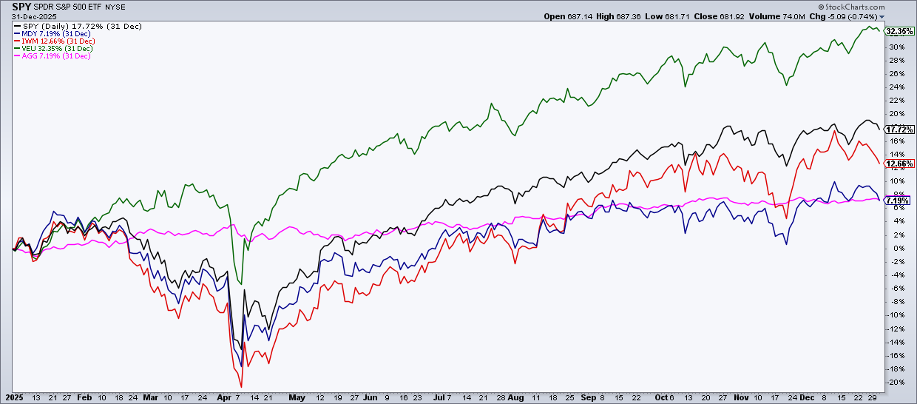
Mid-caps were a laggard in 2025. While the S&P 500 was up 17.7% (dividends included) and IWM posted a 13% total return, MDY was just +7.2% (no better than the bond market). Three sessions into the year, the tables have turned in favor of the market’s often-neglected middle children.
A key piece of the broadening-trade puzzle, mid-caps’ thrust to all-time highs is a bullish indicator ahead of a data- and earnings-heavy few weeks... and a key Supreme Court tariff decision.
Disclaimer: This blog is for educational purposes only and should not be construed as financial advice. The ideas and strategies should never be used without first assessing your own personal and financial situation, or without consulting a financial professional.


