Bull or Bear? Dave Keller’s Four Scenarios for the Nasdaq’s Next Move

After the quick upside reversal during Thanksgiving, investors were curious if the first week of December would see a continuation of the holiday optimism. While the S&P 500 did indeed push higher this week, the index only gained about 0.34% over the five trading sessions.
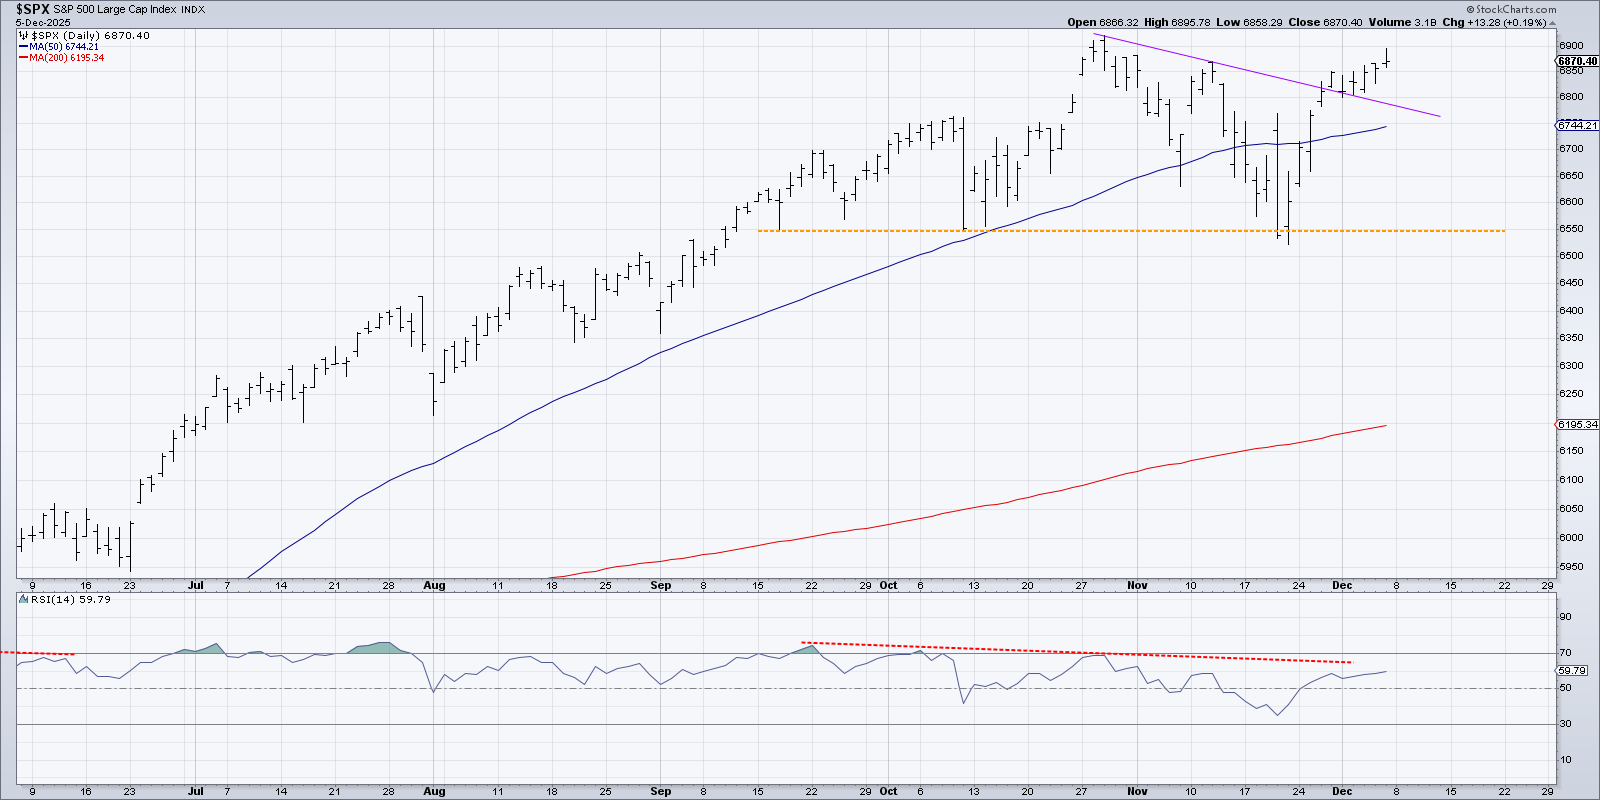
But despite the slower pace to the advance, higher closes on Thursday and Friday have brought the S&P 500 within a rounding error of the October all-time high. After a nasty pullback and fairly meager routines through the end of November, the final month of the year appears to have started with a decent bullish continuation.
So will this uptrend continue through year-end, confirming December as following its seasonal pattern of strength? Or will the market turn lower into the new year, returning to the bearish distribution trend that we observed in the first half of November?
Yes, it’s time again for one of my favorite exercises, called “probabilistic analysis”. This is where we consider four different potential future paths for a major equity index, think about what could cause these scenarios to play out in real life, and reflect on all the different possibilities.
Back in October, we broke down four scenarios for the S&P 500 index. A quick review of the updated chart shows that one of the scenarios was pretty much spot on.
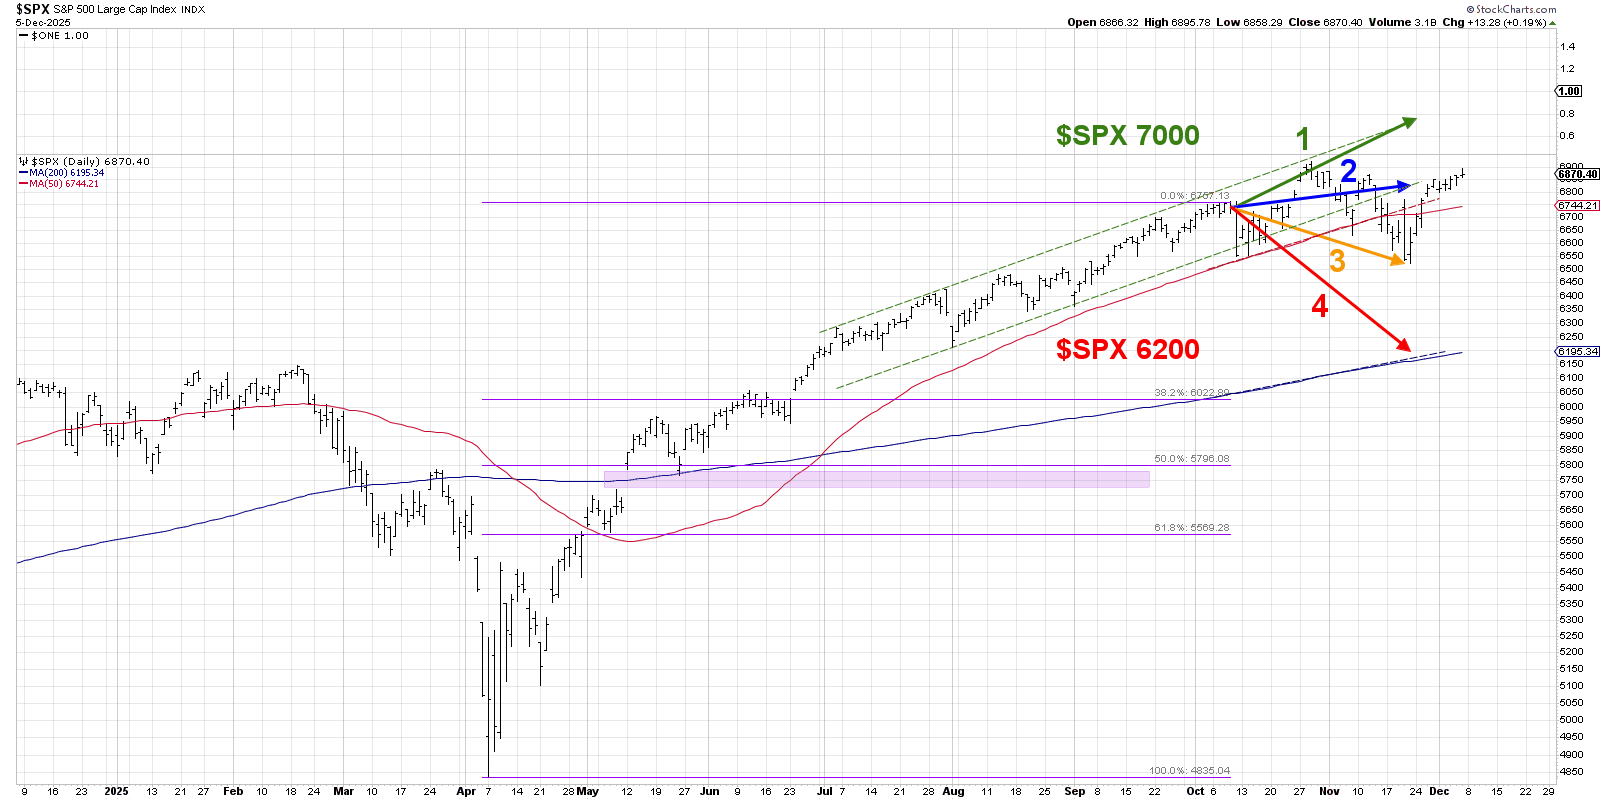
For the first two weeks, the SPX appeared to be following the super bullish scenario with a new high into Halloween. But that late October selloff quickly pushed the index down to meet the end of our yellow arrow, representing the mildly bearish scenario.
Back to the current markets, let’s review four scenarios for the Nasdaq 100 ETF between now and mid to late January 2026. As a friendly remember, the point of this exercise is threefold:
- Consider all four potential future paths for the index, think about what would cause each scenario to unfold in terms of the macro drivers, and reflect on what signals/patterns/indicators would confirm the scenario.
- Decide which scenario you feel is most likely, and why you think that's the case. Don't forget to drop me a comment and let me know your vote!
- Think about how each of the four scenarios would impact your current portfolio. How would you manage risk in each case? How and when would you take action to adapt to this new reality?
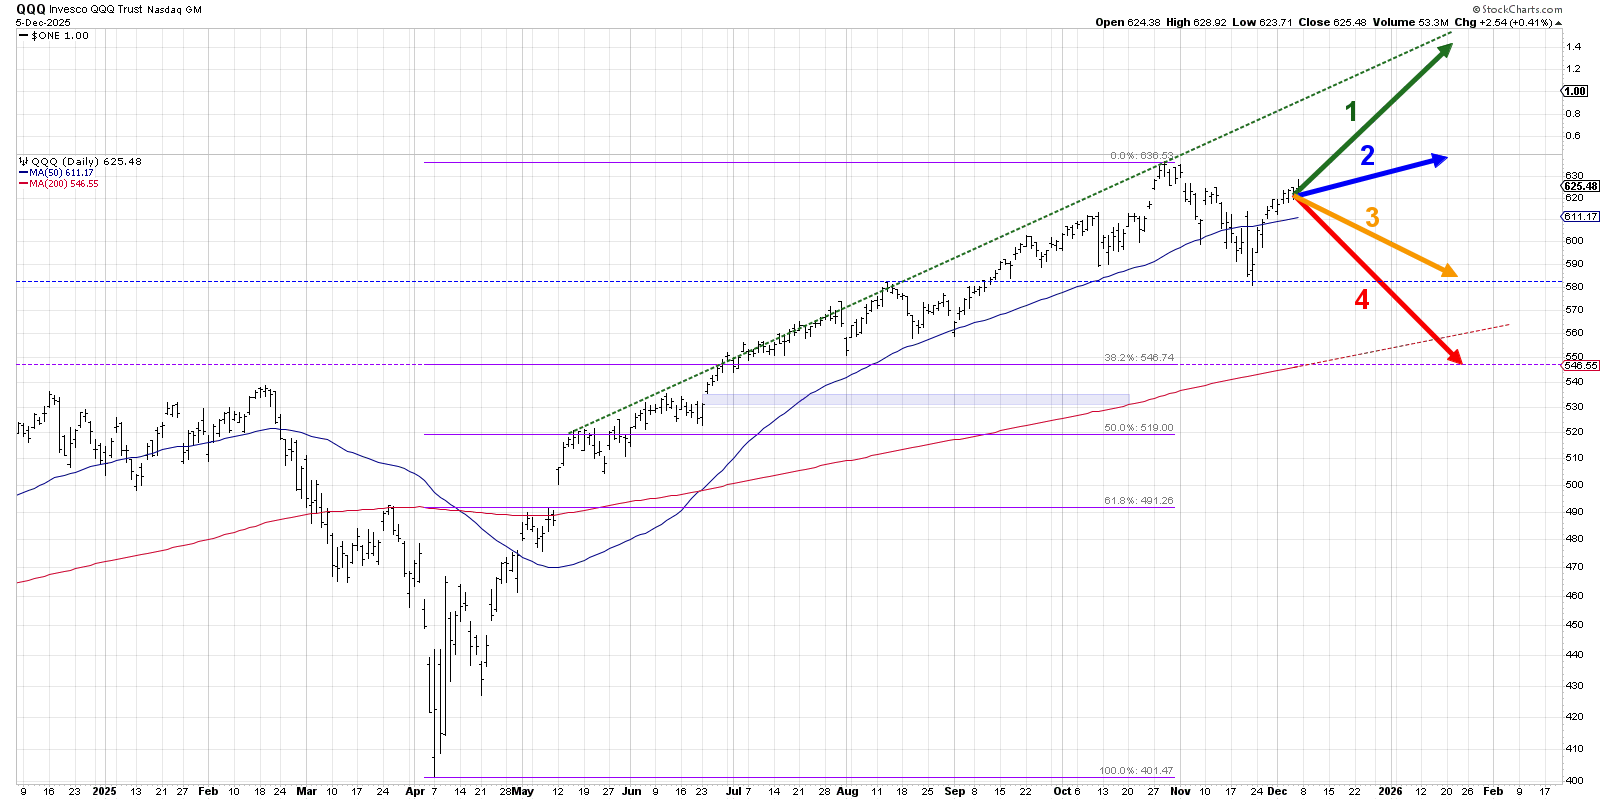
Here’s the chart we’ve created to illustrate the four scenarios. You’ll find a breakdown of each scenario below, along with the probability I’ve assigned for each scenario. Disagree with me? Jump over to my YouTube channel and drop a comment- tell me why I’m wrong!
Let’s start with a very bullish outcome, where the rally starting last week continues at its current pace into late January.
Option 1: The Super Bullish Scenario
If the Nasdaq 100 would continue at its current pace into the new year, it’s reasonable that the chart could extend back up to reach a trendline connecting the major highs off the April low. Basically, the October pullback would be erased and then some, as we get back to the low-volatility uptrend phase we saw over the summer.
For the QQQ to gain that much over the next six weeks, the Magnificent 7 stocks would have to resume their leadership role driven by a continuation of the AI euphoria of 2025. At this point, the Magnificent 7 stocks are a somewhat diverse group of charts right now. Lagging charts like META would need to regain their upward momentum, and most other stocks would follow the trend of mega cap growth.
Dave’s Vote: 10%
Option 2: The Mildly Bullish Scenario
Perhaps not all of the Magnificent 7 stocks regain their footing, and the December Fed meeting and latest macroeconomic data fuels less optimism for investors? I could see a situation where an initial upswing into year-end rotates quickly to a bearish phase in Q1 2026. That would mean that the Nasdaq 100 would be following its normal seasonal pattern of strength in Q4, but the new year would bring a new wave of skepticism that the great AI bull market will continue forever.
If the uptrend continues at a much slower pace, or if an initial upward thrust is followed by a quick pullback, the QQQ could end up right around the late October high around $636. Going into February, investors are debating whether this is just a huge double top pattern, leading to further disbelief and a lack of buying power to push stocks higher.
Dave’s vote: 30%
Option 3: The Mildly Bearish Scenario
If this week’s dribble higher is followed by a downside reversal next week, we could see further distribution bringing the QQQ down to retest its October low around $580. That would leave the Nasdaq between its 50-day and 200-day moving averages toward the end of January.
For the Nasdaq 100 to drop 6–7% over the next six weeks, that would mean the Magnificent 7 stocks would also be struggling. Charts like Microsoft (MSFT) would violate their 200-day moving averages, leading stocks including Apple (AAPL) and Alphabet (GOOGL) would give back some of their recent gains, and investors would be debating whether a further leadership rotation was in store through the first quarter of 2026.
Dave’s vote: 45%
Option 4: The Super Bearish Scenario
Every exercise like this needs a “doomsday scenario” where things get really bad very quickly. Maybe the Nasdaq 100 pounds out an A-B-C correction, with a turn lower into January drops the price down to test the 200-day moving average in January.
In this outcome, I would expect a dramatic reversal in recent relative strength trends. Growth sectors like Technology, which have resumed their previous trend of outperformance, would begin to lag the S&P 500. Defensive sectors such as Consumer Staples and Utilities would surge higher on a relative basis, and the Relative Rotation Graphs would demonstrate a strong move away from offense into defense.
Dave’s vote: 15%
What probabilities would you assign to each of these four scenarios? Check out the video below, and then drop a comment with which scenario you select and why!
RR#6,
Dave
PS- Ready to upgrade your investment process? Check out my free behavioral investing course!
David Keller, CMT
President and Chief Strategist
Sierra Alpha Research
Disclaimer: This blog is for educational purposes only and should not be construed as financial advice. The ideas and strategies should never be used without first assessing your own personal and financial situation, or without consulting a financial professional.
The author does not have a position in mentioned securities at the time of publication. Any opinions expressed herein are solely those of the author and do not in any way represent the views or opinions of any other person or entity.


