Calm Markets, Crude Chaos: Why Oil Is the Odd One Out This Holiday Season

Key Takeaways
- Year-end market volatility is fading, supported by steady macro data and resilient consumer spending.
- Oil prices remain under heavy pressure, defying typical intermarket correlations.
- Energy stocks are holding up better than crude, but technical trends remain broadly bearish.
Barring a dramatic November CPI report, the bulk of December’s volatility catalysts are now in the rearview mirror. The balance of the year should feature light volume and low volatility, if history is any guide.
Recall last week that the AI trade was put to the test with earnings reports from Oracle (ORCL) and Broadcom (AVGO). While they did not fail miserably, price action in the pair of once-high fliers was a lump of coal.
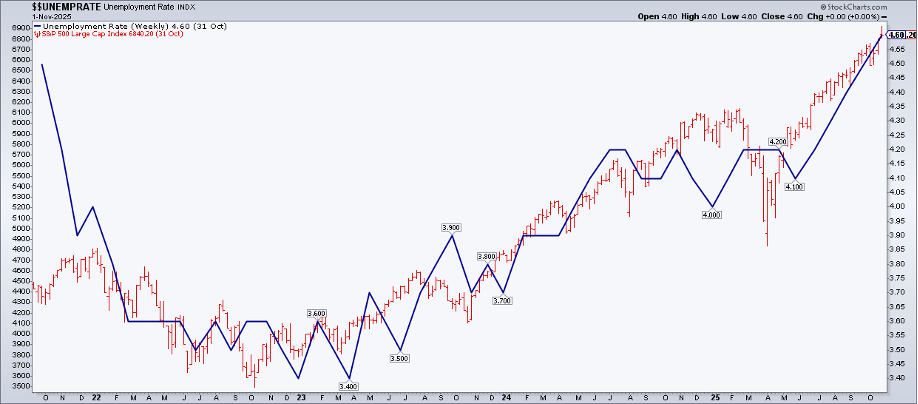
This week, clues on the macro were met with sighs of relief. The October and November jobs reports didn’t shock to the downside, despite the unemployment rate rising 0.12 percentage points to 4.564% from September to November.
Holiday Spending Stays on Track
By most accounts, the holiday shopping season has been a smooth sleigh ride. On Tuesday, shortly after both Employment Situation reports hit the tape, Johnson Redbook retail sales revealed a tick up to 6.2% YoY for the week ending December 13.
The October Retail Sales report published by the U.S. Census Bureau was also merry, with a 0.8% monthly rise in the core control group (which will feed into Q4 GDP).
One Last Macro Test: CPI
There’s one more macro gift under the tree: November CPI. Will it matter a ton? Maybe not. With the next Fed decision not until January 28, there will be December data to dissect next month for the 2026 FOMC (which will include Stephen Miran at next year’s first meeting).
The inflation backdrop may be best described as “warm and cozy,” not “hot and unstable.” Stocks should do fine if forward-looking inflation swaps are correct (the 1-year inflation swap is priced at 2.24%, a 52-week low).
All Is Calm on the Volatility Front
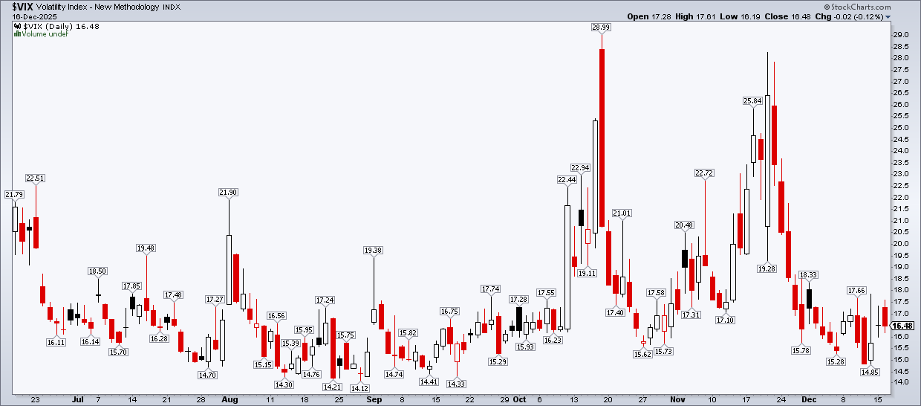
It’s not surprising that the Cboe Volatility Index ($VIX) is now closer to 15 than 20. Remember, markets are shuttered on Dec 25 and Jan 1, and there is a half-day of trading on Christmas Eve. As traders close up shop for the rest of the year, “all is calm” could be the prevailing theme.
Oil Is the Exception
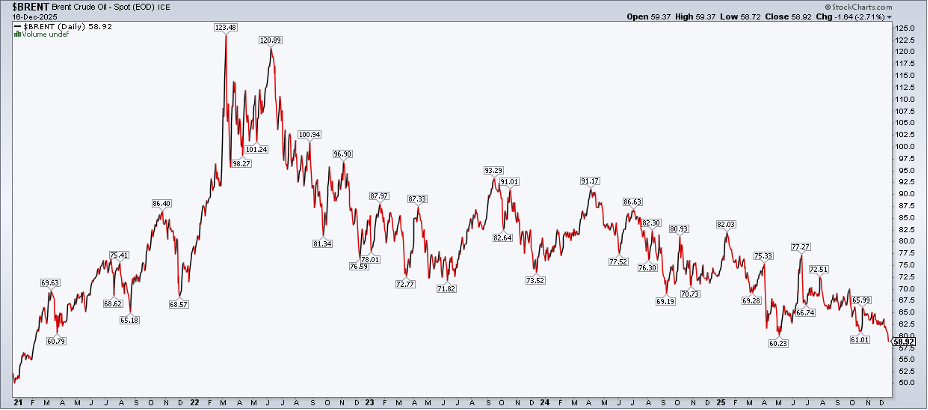
Where is price action not so calm? Oil. A barrel of WTI plunged to near $55 earlier this week, with Brent busting through the $60 mark for the first time since February 2021. Natural gas has also come under selling pressure after a November–early December surge toward $6 per MMBtu.
Henry Hub prices move on the whims of the latest winter temperature forecasts, but it’s clear that oil is in a more fundamentally bearish state thanks to high global production, plus the chance of additional supply hitting the market amid intensified Western sanctions targeting major Russian oil firms.
Geopolitics Jolt Crude Prices
That said, both U.S. and global oil caught a bid on Wednesday. The U.S. ratcheted up pressure on foreign adversaries, namely Venezuela. President Trump ordered a total blockade of tankers entering and leaving the South American nation. The U.S. has built up its largest military presence in the region in decades, leading many macro watchers to take their eyes off of Russia and focus instead on the Maduro regime.
A Long-Term Downtrend Remains Intact
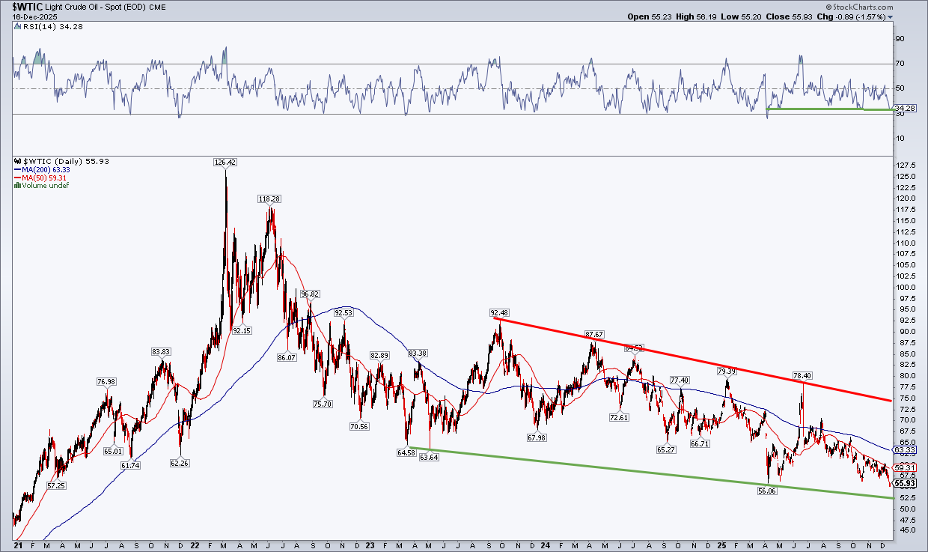
Technically, bears have controlled WTI’s primary trend for the better part of the last three years. Notice in the chart below that oil could find support from a downtrend line near $52, but it has not been a consistent channel since 2023. Resistance appears more significant. The downtrend line off the $92.48 peak from more than two years ago now enters the picture in the mid-$70s.
Also, take a look at the RSI momentum oscillator at the top of the chart. It has touched 30 a few times this year, so the midweek price bounce makes sense based on that indicator. However, with a falling long-term 200-day moving average (and the 50-day moving average trending down above the 200-day), December has been a month to forget for oil bulls so far. Both WTI and Brent could notch their worst years since 2020.
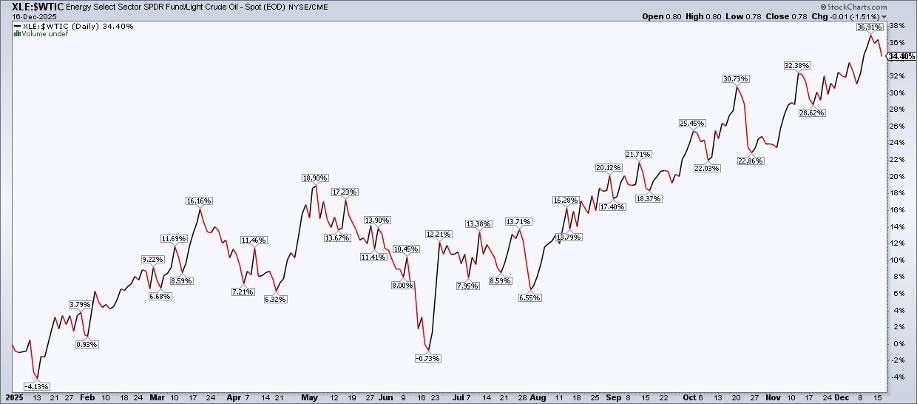
Oil Stocks Look Better Than the Commodity
Oil equities are doing better. The Energy Select Sector SPDR ETF (XLE) has outperformed the prompt month of WTI futures by 34 percentage points in 2025. Shares of oil and gas companies began to outperform the commodity in June, which I generally view as a constructive development for the broader stock market. Earlier this week, I put the spotlight on Exxon Mobil (XOM).
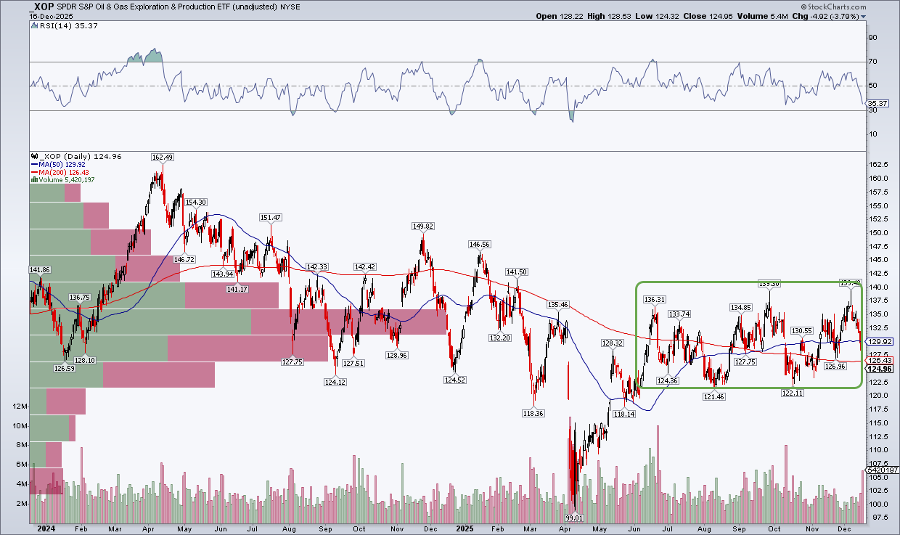
Unlike oil, XOM is closer to its 52-week high than its 52-week low. Higher-beta Energy-sector plays are less constructive, in my view. Often, when oil is in rally mode, U.S. drillers perform best. For that exposure, the SPDR S&P Oil & Gas Exploration & Production ETF (XOP) is a popular vehicle.
Not surprisingly, XOP’s chart is a proverbial oil spill. Before bouncing on Wednesday, the ETF dropped below its 200-day moving average after notching a near-term double top earlier this month. It has been dead money for the past 3.5 years. Support likely sits in the low $120s, while a breakout above $140 would be needed to turn momentum around.
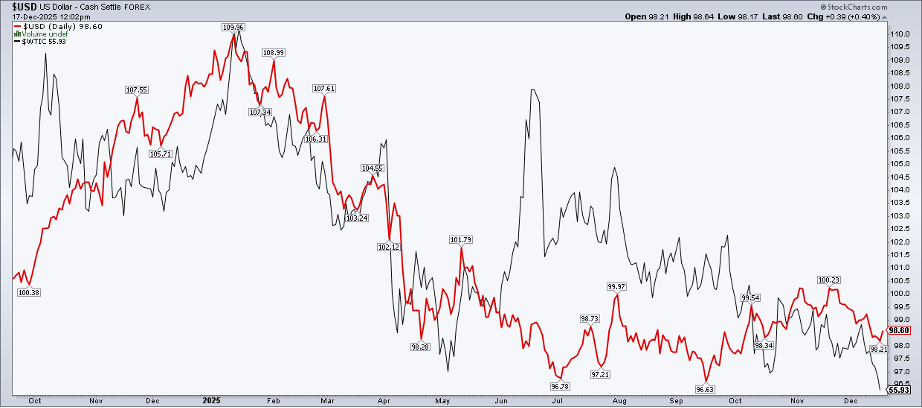
When Correlations Break Down
Stepping back, what makes oil’s dreadful multi-year performance even worse lately is that it has coincided with a weak dollar. The U.S. Dollar Index ($USD) was above 110 in January but is now below 99.
Intermarket 101 tells us that, in an inflationary environment, a weaker greenback should act as an oil tailwind. Not so in 2025. In fact, the dollar and oil trended down in tandem from January through April. The usual inverse correlation is not reliable, at least not at this time.
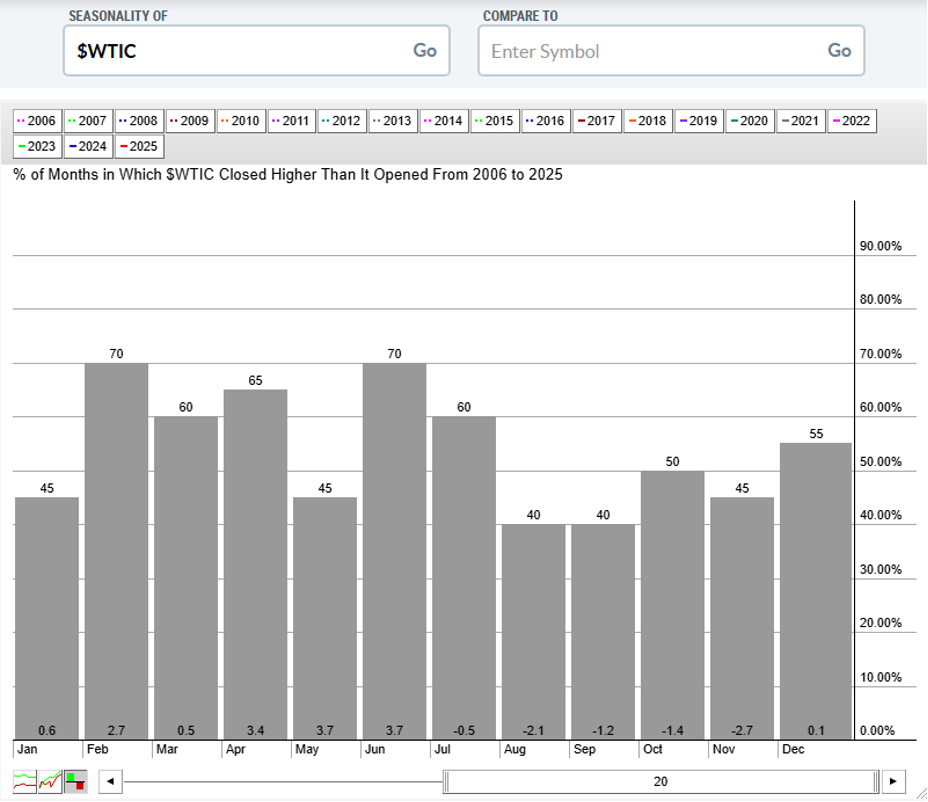
The saving grace? Oil has historically performed well in the first half of the year.
The Bottom Line
Oil equities have by no means been strong this year, or really at any point since the bull market began 38 months ago, but they look like all-stars compared to oil itself. Having printed a $55.20 low earlier this week, a broad downtrend remains intact in both WTI and Brent.
Disclaimer: This blog is for educational purposes only and should not be construed as financial advice. The ideas and strategies should never be used without first assessing your own personal and financial situation, or without consulting a financial professional.


