Smart Investors are Watching These Chart Signals: Here's Why

Key Takeaways
- Daily and weekly Bollinger Bands show the S&P 500 is working its way back toward the upper edge, a level often associated with strong bull markets.
- The 14-week RSI has yet to reach overbought territory, a move that will indicate that long-term momentum is in gear.
- GoNoGo signals investors are buying the dip but there needs to be more upside follow-through.
Let’s walk through some key insights from the charts, focusing on three indicators.
Daily Bollinger Bands: A Calm Before the Storm?
On the daily chart of the S&P 500 ($SPX) below, notice that the S&P 500 is now noticeably above its lower Bollinger Band, which it had just tagged a few days ago. This was the first time the index touched the lower band since the lows earlier this year.
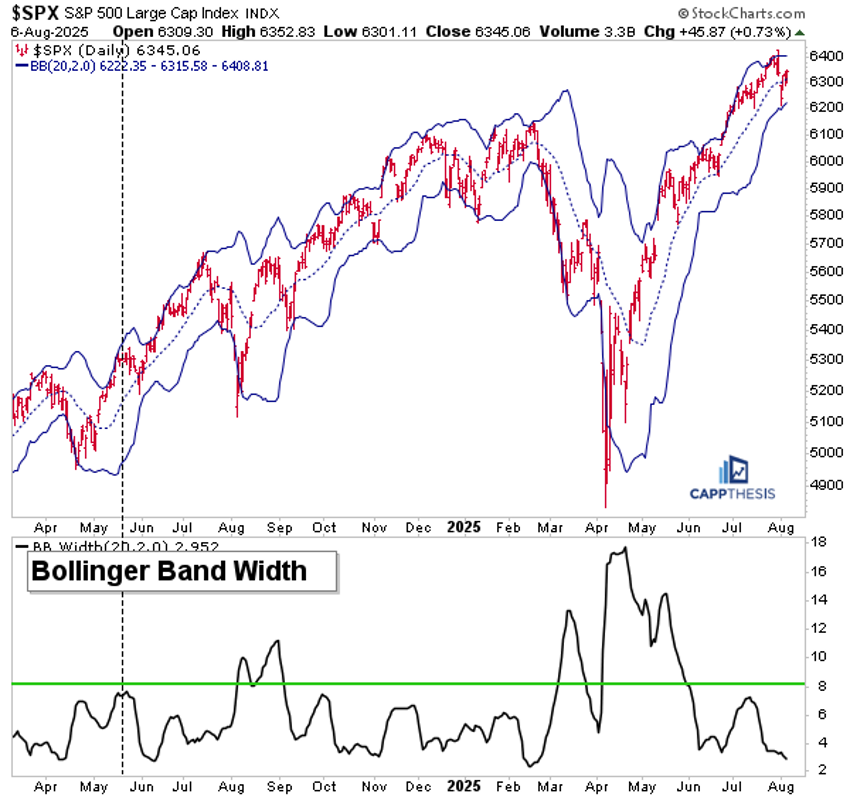
While the pullback has only been around 3.5%, the reason the S&P 500 hit the band is that the recent low-volatility environment narrowed the bands. The second panel of the chart, which displays the Bollinger Bandwidth, shows that the width has compressed back to levels last seen earlier in the year.
Bears may point out that the last time the bandwidth hit a similar low, which was in February, the market rolled over. But it’s important to remember that between September and February, the bandwidth remained narrow while the market climbed higher.
Needless to say, a hallmark of a steady uptrend is low volatility, which can be measured in several ways, Bollinger Bandwidth being one of them. The next technical step would be for the index to retest the upper band, which it was riding for much of June.
Weekly Bollinger Bands: The Bigger Picture Looks Stronger
Turning to the weekly Bollinger Bands, it’s clear that in the strongest market environments, the S&P 500 routinely reaches (and stays near) the upper band for months. Also worth noting is that when this happens, the index rarely revisits the lower band, as evidenced by the consistent cluster of blue arrows over the years (see chart below).

The recent comeback has pulled the index from noticeably below the lower band back toward the upper threshold. It’s not quite there yet, but it’s getting close.
One reason it has taken longer to reach the upper band is that earlier this year, volatility was elevated, which made the weekly bands much wider than normal. Unlike the daily bands, the weekly bands haven’t contracted yet. However, if the market continues its persistent trend, the weekly bands should also begin to contract.
The next technical milestone to watch for would be to see the S&P 500 consistently reaching and holding near the upper weekly Bollinger Band. That’s a classic sign of a strong, trending bull market.
Weekly RSI: Another Bullish Signal Brewing?
At the recent lows, we noted how the S&P 500’s 14-week Relative Strength Index (RSI) had dropped to levels among the lowest we’ve seen since the Global Financial Crisis. As the chart below shows, whenever the RSI reached those depths, it often marked, or came close to, major long-term lows, especially following sharp market crashes. These instances are marked by vertical red lines on the chart below.
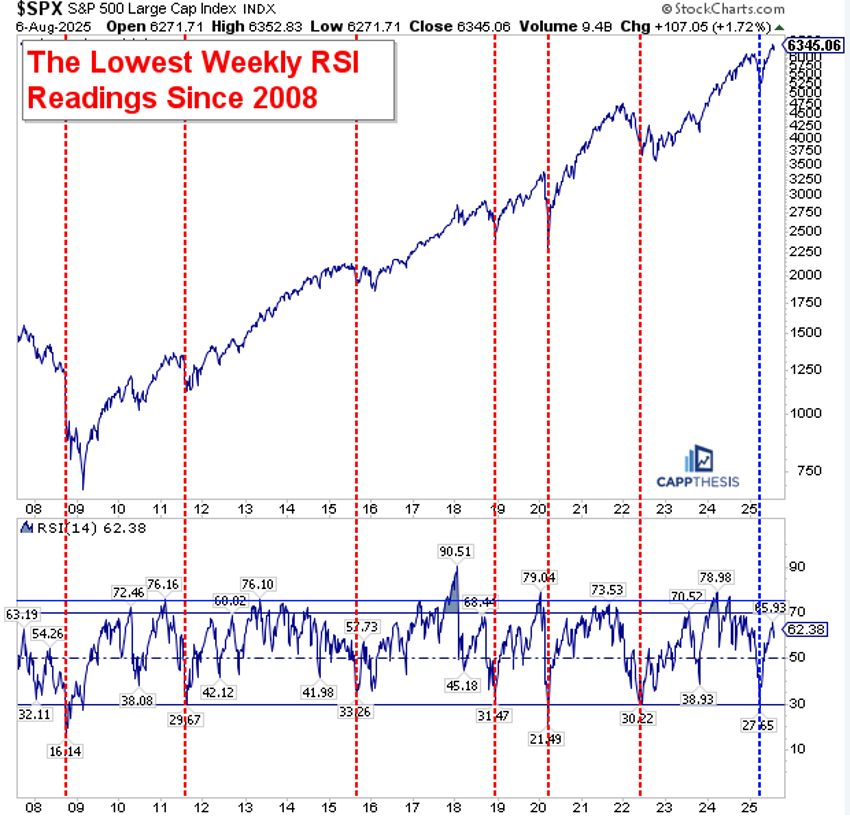
The most recent instance, marked in blue, has so far followed the same pattern: a sharp bounce off the lows, followed by a strong extension and now new highs.
As the chart illustrates, in the past, these types of RSI signals not only marked key lows but also preceded multi-year upside follow-through.
One thing that hasn’t happened yet is that the weekly RSI has not returned to overbought territory. Historically, that eventual breakout above 70 was a key component of the longer-term momentum thrusts that followed each prior signal.
So, while the setup is constructive, we’ll want to see the weekly RSI confirm by moving into overbought territory again, a sign that long-term momentum is fully back in gear.
GoNoGo Trend: Daily Signals Are Encouraging
So far, the counter-trend signals that have appeared on the GoNoGo chart have also led to buy-the-dip behavior. That, again, happened on Monday, but we’ll need more upside follow-through. Wednesday was a good sign from that perspective.
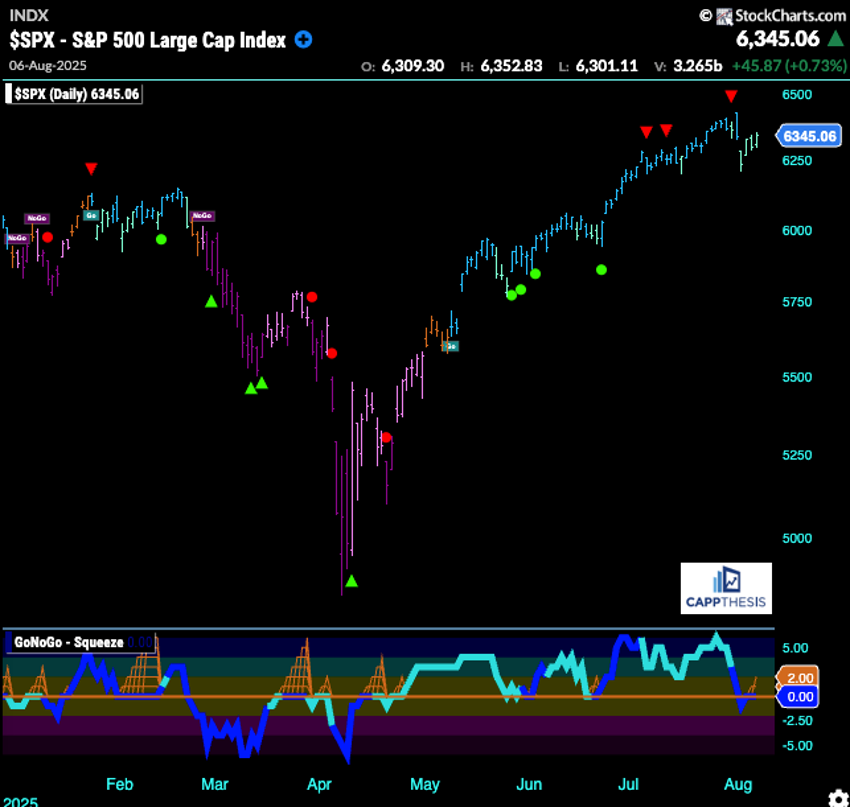
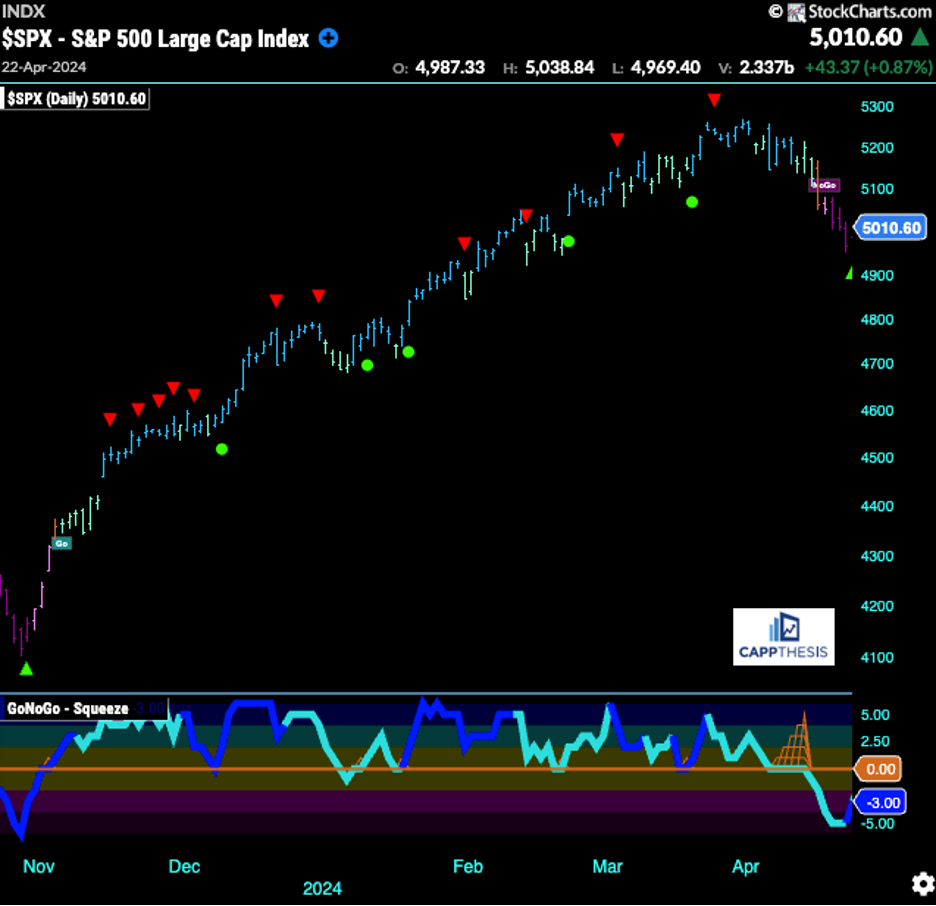
This is important because this same dynamic was prevalent throughout much of the rally from late 2023 through March 2024, as the market extended higher in a consistent and orderly fashion – much like what we’ve been seeing over the last several months.
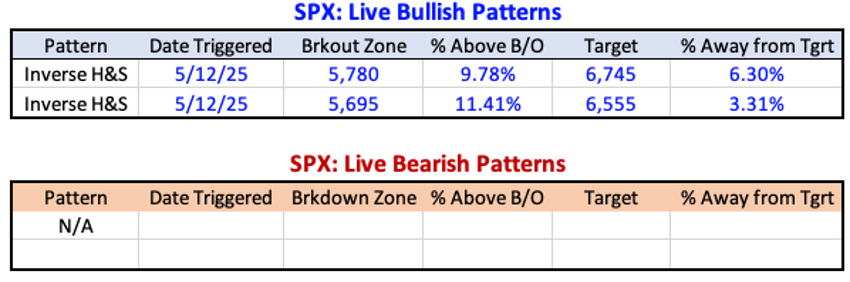
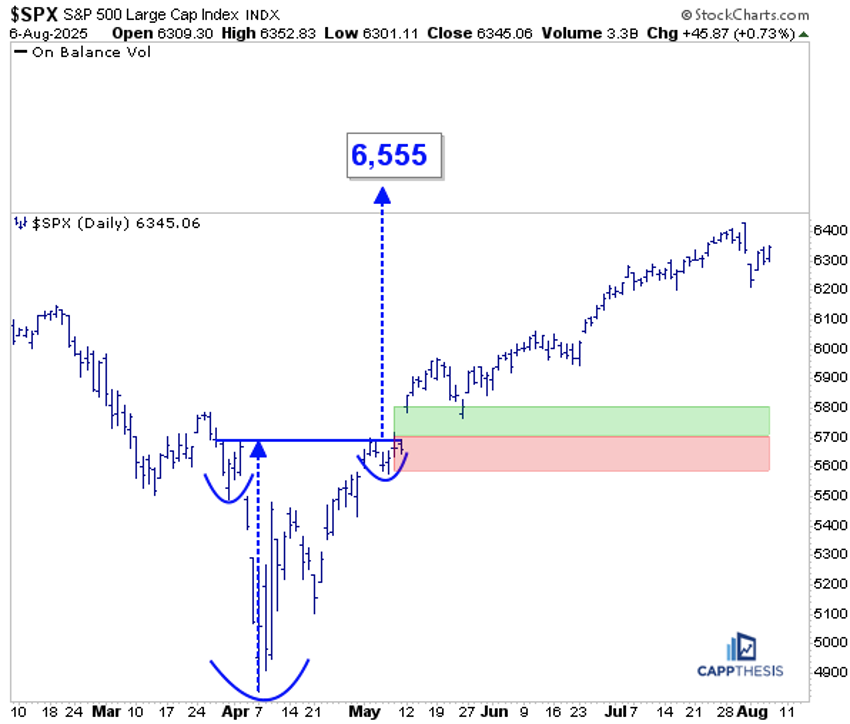
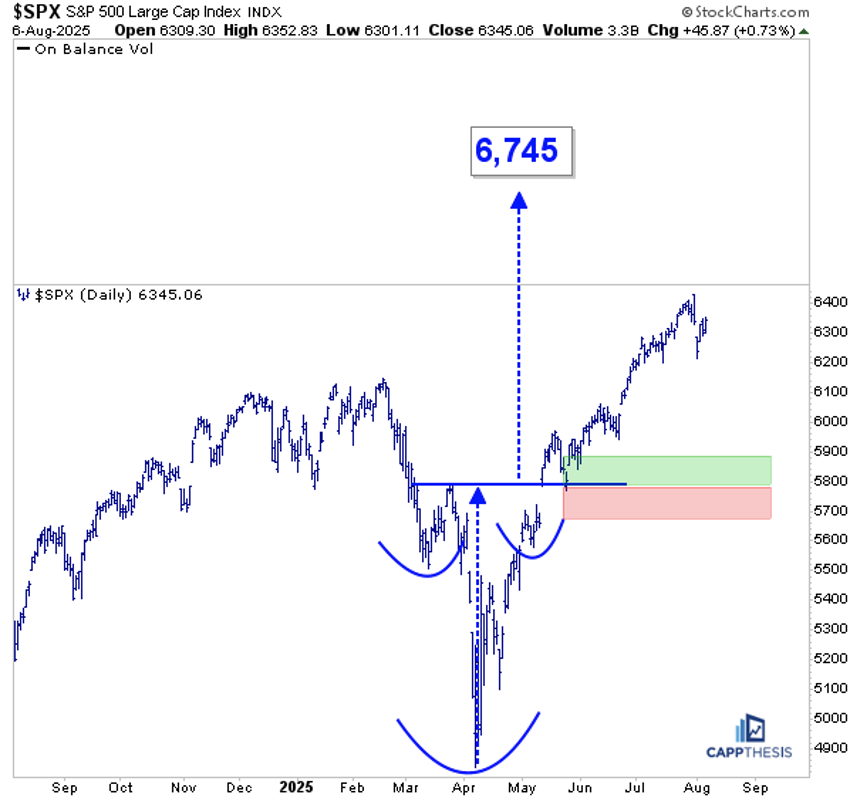
Live Patterns: Still Bullish
Our two live bullish patterns remain: targets of 6,555 and 6,745. These could be with us for a while going forward. For those to eventually be achieved, though, new, smaller versions will need to be constructed.
Potential Patterns via a Short-Term Lens
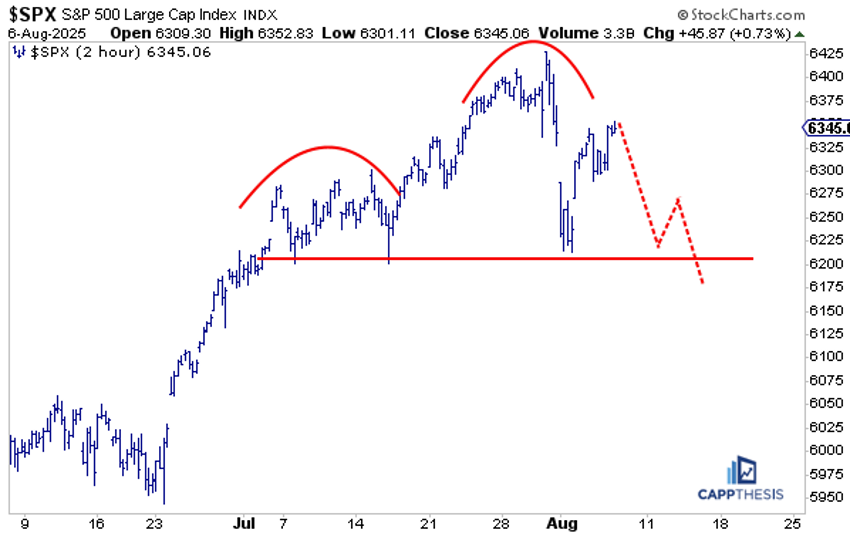
For the first time since the lows, a short-term formation has been building. This is best seen on the two-hour chart (see below).
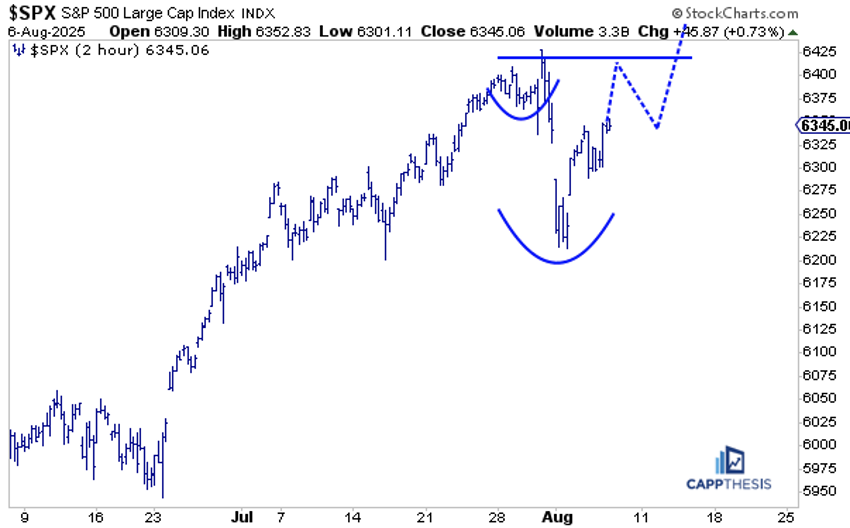
As that continues to form, this bearish version also has been in the works. This is the same chart for both variations.
What Does This Tell Us?
With the S&P 500’s recent back-and-forth action, we need to be prepared for both a breakout and breakdown and react accordingly.


