Charting the Week Ahead: Where Is Nifty Headed Next?
The markets traded with a positive undertone through the week, rebounding smartly from lower levels. After reacting positively to the strong Bihar election outcome and hopes around a potential US-India trade agreement, Nifty posted steady gains throughout the week. The index oscillated in a range between 25,449 and 26,010, marking a trading band of 561 points. India VIX declined by 4.94% on a weekly basis to close at 11.94, indicating continued risk appetite. By the end of the week, Nifty registered a net gain of 417.75 points or 1.64%.
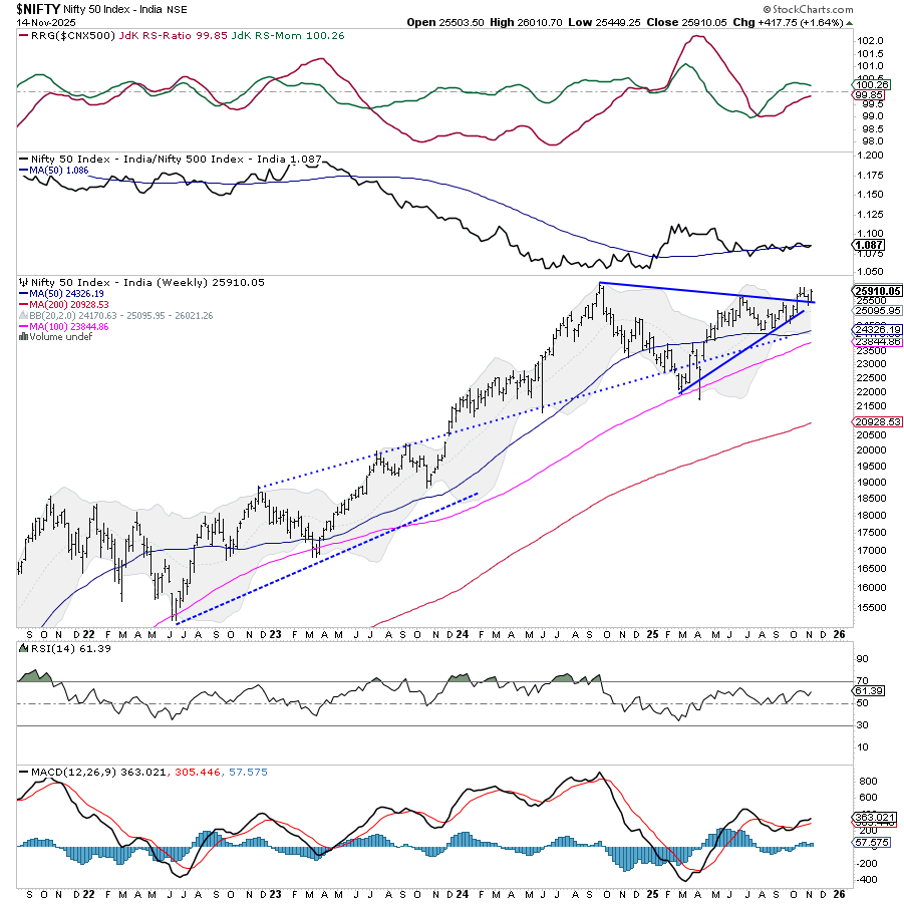
The current technical setup reflects a structurally strong market that is steadily grinding higher with broadening participation. Nifty is comfortably placed above key moving averages and is navigating the symmetrical channel it broke out from a few weeks ago. It is testing the upper Bollinger band near 26,045, suggesting that while momentum remains intact, some near-term consolidation cannot be ruled out. The index has not shown any signs of exhaustion yet, and the broader uptrend remains well in place. A move beyond the recent high of 26,010 may accelerate momentum, whereas supports now have been dragged higher to the 25,700–25,500 zone.
Given the strong finish last week, Nifty is likely to see a stable to positive start to the coming week. Resistance is expected near the 26,050 and 26,200 levels. On the lower side, immediate support exists at 25,600, followed by a more important zone around 25,400.
The weekly RSI stands at 61.38, which is bullish and remains neutral against price with no divergence observed. The weekly MACD is above its signal line and rising, supporting the strength in momentum. No major bearish candlestick pattern has formed on the weekly chart; instead, the current candle is a solid bullish body near the upper Bollinger band, indicating strength.
From a pattern analysis standpoint, Nifty remains in a well-established uptrend and continues to hold above the breakout zone of the symmetrical triangle pattern it had resolved earlier. The index is trading well above its 50-, 100-, and 200-week moving averages, which continue to rise and support the long-term bullish structure. The setup shows no immediate signs of reversal or weakness.
Given the current structure, market participants should stay positively biased but exercise selective aggression. With the index trading near upper channel boundaries, chasing prices blindly should be avoided. Fresh longs should ideally be considered on dips near defined support zones. It would be prudent to trail profits higher and adopt a stock-specific approach while remaining alert to global and domestic news triggers. A disciplined, rotational strategy focused on sector leaders and relative strength would be the ideal way to navigate the coming week.
Sector Analysis for the Coming Week
In our look at Relative Rotation Graphs®, we compared various sectors against the CNX500 (NIFTY 500 Index), representing over 95% of the free-float market cap of all the listed stocks.
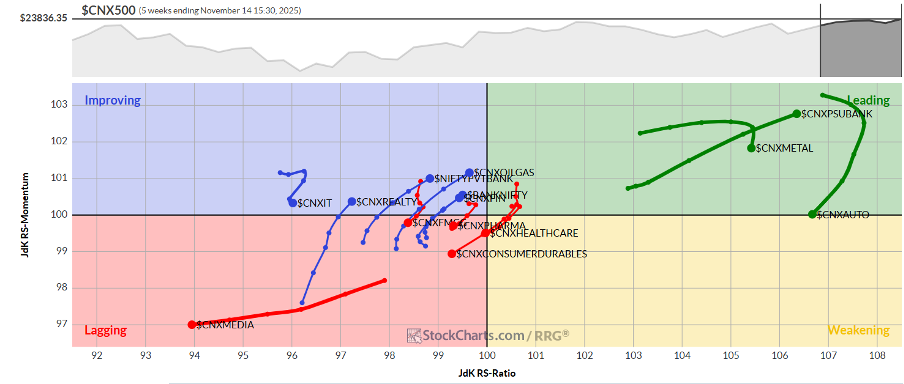
Relative Rotation Graphs (RRG) continue to show NIFTY Auto, Metal, and PSU Bank Indices inside the leading quadrant. While the Metal and the PSU Bank sectors are rotating strongly, the Auto group can be seen giving up on its relative momentum. However, these groups are likely to relatively outperform the broader Nifty 500 Index.
While the Nifty Midcap 100 Index is the only sector index in the weakening quadrant, it has sharply improved its relative momentum, indicating broader market participation in the moves the markets are currently making.
The Nifty Financial Services, Realty, BankNifty, and the Infrastructure Indices are inside the lagging quadrant. However, they are sharply improving their relative momentum against the broader markets. The Media, Services Sector, Pharma, FMCG, and the Commodities Indices are languishing inside the lagging quadrant and may relatively underperform the broader markets.
The Nifty Energy Index has rolled inside the Improving quadrant. This marks a potential beginning of its phase of relative outperformance. The Nifty PSE Index is also rotating decently within the improving quadrant; the IT Index, on the other hand, continues to pare down its relative momentum.
Important Note: RRG™ charts show the relative strength and momentum of a group of stocks. In the above chart, they show relative performance against NIFTY500 Index (Broader Markets) and should not be used directly as buy or sell signals.
Milan Vaishnav, CMT, MSTA
Consulting Technical Analyst
www.EquityResearch.asia | www.ChartWizard.ae


