Stocks Look Stalled: These Charts Point to Where the Market Could Head Next

The stock market struggled to get moving early this week. After Friday’s relief rally, Monday fizzled out without much follow-through. Tuesday looked like it might repeat the pattern – until the final hour of the trading day, when the S&P 500 ($SPX), Nasdaq Composite ($COMPQ), and Dow Industrials ($INDU) turned higher. The S&P 500 closed just one point shy of its Friday high.
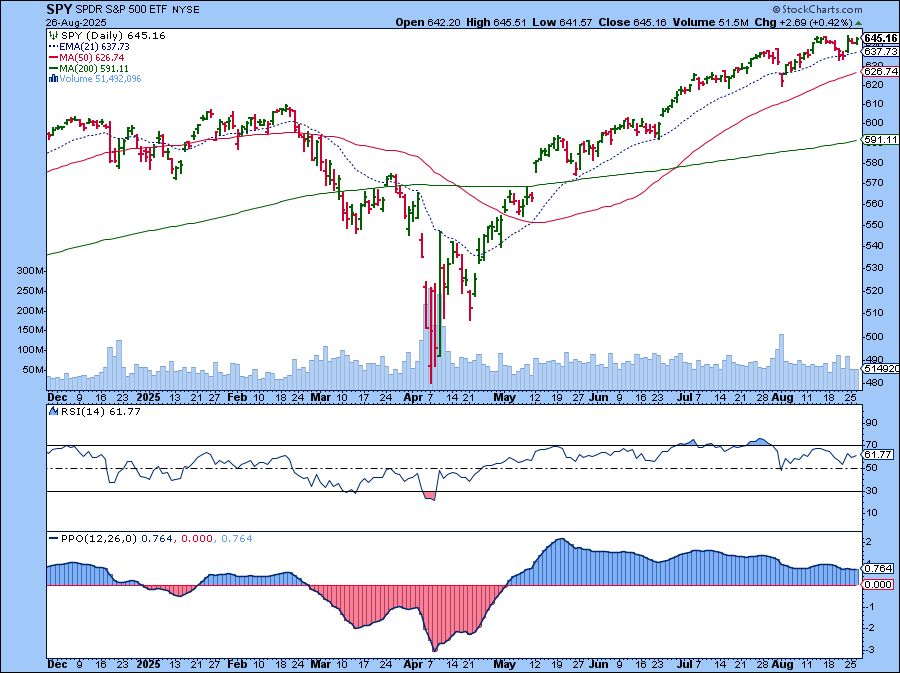
Despite the recent headlines, the stock market has lacked excitement. Price swings have been relatively contained, and momentum hasn’t really taken off. The daily chart of the SPDR S&P 500 ETF (SPY) below shows a relatively neutral to flat Relative Strength Index (RSI) and Percentage Price Oscillator (PPO). Still, the bigger picture remains bullish. SPY is trading above its upward-sloping 21-day exponential moving average (EMA).
All Eyes on NVIDIA (NVDA)
The next big market-moving event could be NVIDIA (NVDA) earnings, which are due after Wednesday’s close. On Tuesday, NVDA was the most actively traded stock in the S&P 500, closing up about 1.1%. The stock price rose in after-hours trading, but the real test will come once earnings are released.
Expectations are high and, if NVDA delivers, the broader market could see another leg higher. An earnings miss would send the stock market in the opposite direction. Either way, NVDA’s price action will be a key signal for whether tech stocks still have fuel in the tank or if it’s time to consider other areas of the market.
Small-Cap Stocks: Quiet but Interesting
Now that Wall Street has priced in a 25-basis-point interest rate cut in September, small-cap stocks, which tend to be interest-rate sensitive, are holding up well. Below is a comparison of the one-year performance of the SPDR Portfolio S&P 600 Small Cap ETF (SPSM) and the SPDR S&P 500 ETF (SPY). Even though SPSM is underperforming SPY, its performance is improving.
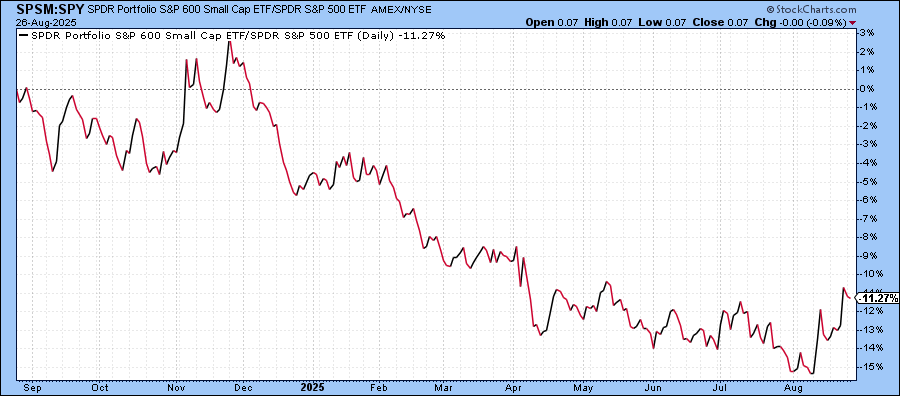
This is a chart worth saving to one of your ChartLists so you can revisit it regularly. If small-caps start to accelerate, it may be an opportunity to consider adding small-cap stocks to your portfolio.
Financials Step Into the Spotlight
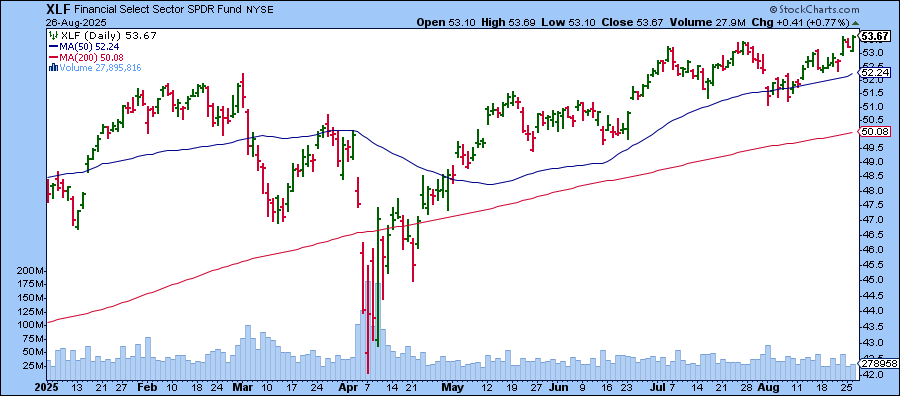
Rate-sensitive financial stocks, which make up a good slice of the small-cap universe, have perked up. The Financial Select Sector SPDR Fund (XLF) just hit a record high. Meanwhile, both the SPDR S&P Bank ETF (KBE) and the SPDR S&P Regional Bank ETF (KRE) have broken above key resistance levels, and look ready to march towards their all-time highs.
One chart to watch closely is the S&P Financial Sector Bullish Percent Index ($BPFINA). It's at 68, which indicates the sector is favoring the bulls. A cross above 70 would be a strong bullish signal.
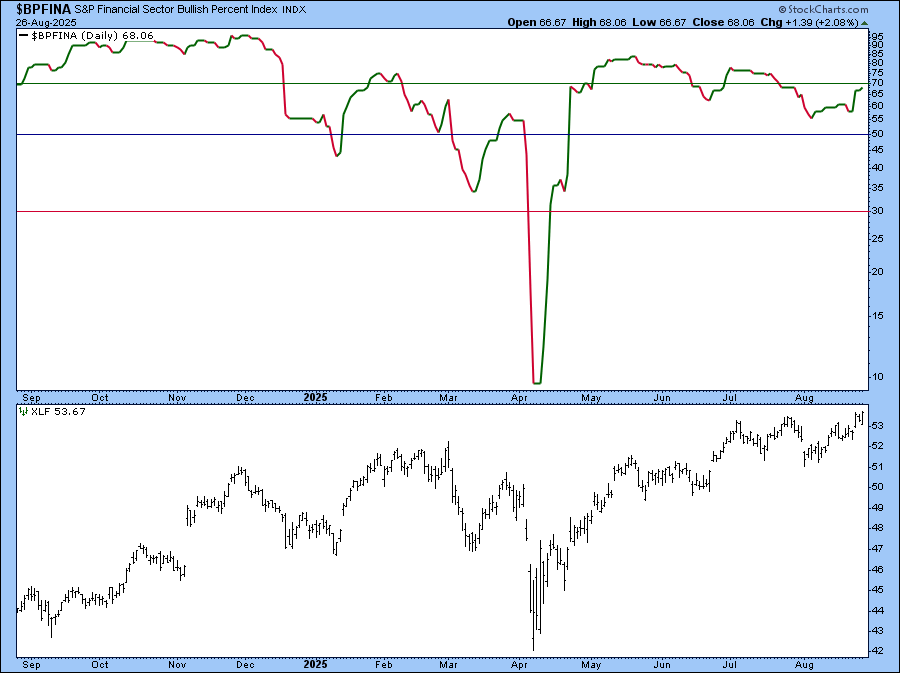
For a comparison, change the symbol to $BPINFO, the S&P Technology Sector Bullish Percent Index, and you'll see that it’s sitting at 50, which is neutral.
Looking Ahead
While the first two trading days of this week may have been quiet, the second half could be much livelier. Alongside NVDA earnings, we’ll get the July PCE, the Fed’s preferred inflation gauge, on Friday.
There’s a lot to look forward to. Stay engaged with the market, be ready to lighten positions in areas that are losing steam, and consider adding exposure to asset groups that are showing strength.
Disclaimer: This blog is for educational purposes only and should not be construed as financial advice. The ideas and strategies should never be used without first assessing your own personal and financial situation, or without consulting a financial professional.


