Commodities Moving the Chains in Early 2026

Key Takeaways
- Point & Figure signals flash a breakout as broad commodities finally join the precious metals rally.
- Measured-move targets suggest DBC still has room before testing long-term 2022 highs resistance.
- Oil’s momentum shift could decide whether this trade reaches the end zone.
Ahead of the NFL divisional playoff round this weekend, the commodity bulls are charging down the field. It’s not just silver and gold anymore. The Invesco DB Commodity Index Tracking Fund (DBC) is off to a fast start in the first quarter, with hardly any timeouts for the bears to catch their breath.
I called out some decent—but not incredible—trends among hard assets and the resource trade in mid-Q4, but DBC’s rally paled in comparison to what was happening in the metals and even equities.
Drawing Up the Playbook: Why Point & Figure Matters
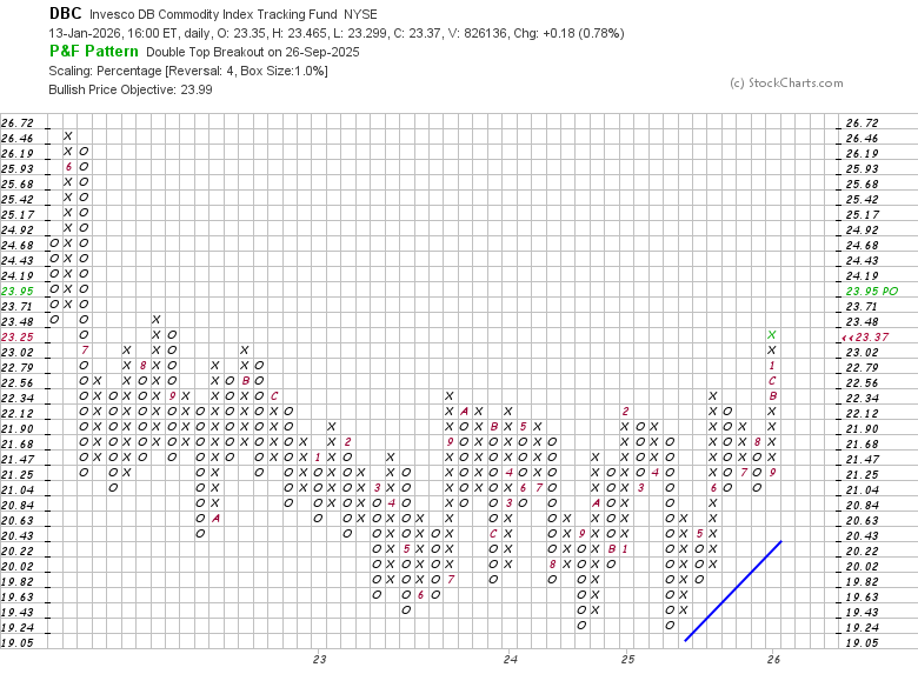
The kickoff to 2026 has been outright stellar for commodities, and I was particularly intrigued by DBC’s Point & Figure (P&F) view. Just as a coach outlines a winning play for his team, X's and O's illustrate trends and call out strategies for technicians with this chart type. It’s an old-school look, but many technicians assert Point & Figure provides the clearest breakout signals.
X’s and O’s on the Chalkboard: DBC’s Breakout Setup
You don’t have to be a seasoned CMT to quickly become a Point & Figure savant, either. StockCharts’ P&F Pattern Alerts tell you the latest play, so to speak. In DBC’s case right now, there’s an active Double Top Breakout pattern. Unlike traditional line, OHLC, or candlestick charts, Point & Figure charts require user input for specific parameters, such as scaling method, reversal count, and box amount.
Today, DBC’s breakout is more clearly displayed using the Percentage Method, 4-count Reversal, and 1.0% Box Percent. You can see it without tinkering with the inputs on StockCharts’ Market Summary page (this is actually how I came across this breakout gem earlier this week). Importantly, in Point & Figure charts, price patterns and technical targets vary depending on the chart's attributes and scaling.
In short, DBC has a precise $23.95 upside price objective based on the above inputs.
The Drive’s Winning Play
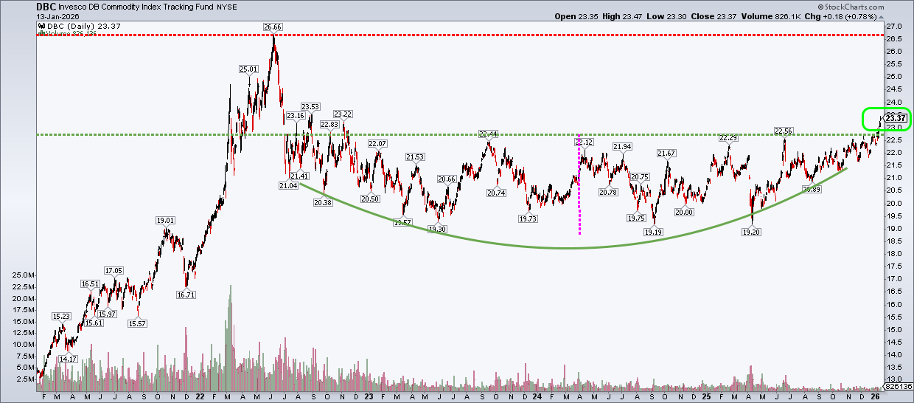
But we also aren’t confined to Point & Figure. A basic DBC SharpChart reveals a clear breakout. I admit I was early on my bullish commodities call two months ago.
Today, DBC’s rally through the mid-$22s triggers a measured-move upside price objective to near $25.80, based on the depth of the extended rounded bottom/consolidation that played out over more than three years. $25.80 is just shy of the June 2022 peak of $26.66.
We might just be at halftime for this trade.
The Quarterbacks of the Trade: Oil Has to Step Up
Besides “more buyers than sellers,” what might it take for DBC to reach the proverbial end zone? We need oil to make some big plays.
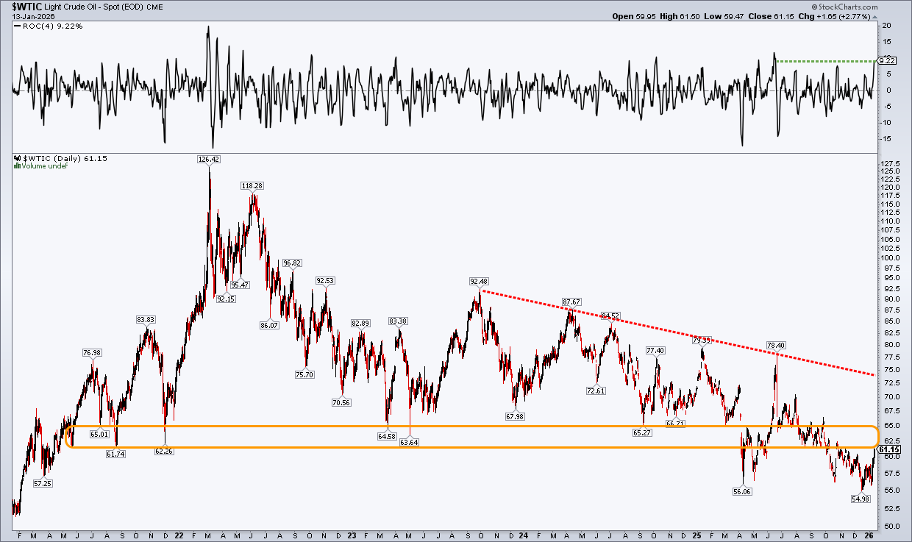
WTI and Brent are the dual quarterbacks of commodities, but they have been in a major slump dating back to inflation’s heyday in mid-2022. A steep downtrend since the Twelve-Day War in the Middle East last June has capped DBC’s advance—but that may be changing.
Readers know I love my Rate of Change (ROC) SharpCharts indicator. WTI is up four sessions running, posting a 9.2% climb from last Thursday through this past Tuesday. That’s its best move since the Iran–Israel conflict. I think a bullish reversal in oil is underway; the hallmarks are there...
Momentum Shift: Bears Are Flagged
...WTI and Brent futures positioning was offside coming into 2026, headlines were dreadfully bearish after the overthrow of the Maduro regime, and you can’t go a few minutes into an energy market discussion without “supply glut” being mentioned. Now, with a technical thrust, the bulls might be poised for a heroic comeback.
U.S. oil’s first big test—call it a 3rd-and-short—happens right now. There’s a resistance zone from $62 to $65 in play. A rally through there would put WTI back within its previous trading range, with long-term resistance from a downtrend line in the low $70s. Above $75, and the bears may resort to Hail Marys to take back the ball.
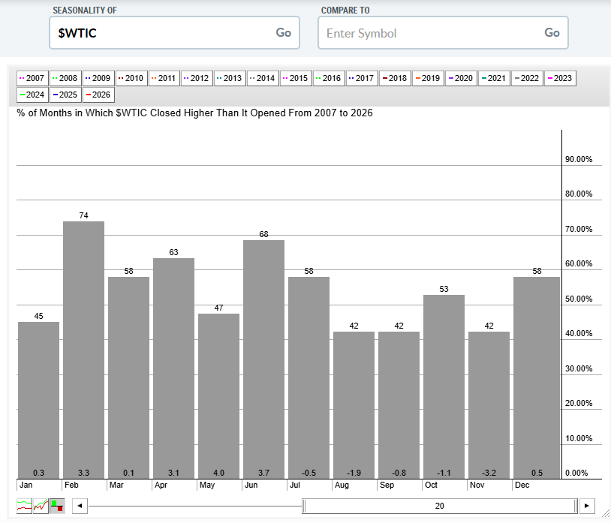
Home-Field Advantage: Seasonality Is on Oil’s Side
So, will a bullish tush-push to $65 or higher occur? History suggests there’s a good chance. Peeking at $WTIC seasonality, we uncover that February through June is oil’s home-field advantage from a calendar perspective. The middle of the first quarter is the best month, averaging a 3.3% gain and finishing higher 74% of the time since 2007.
At the very least, I suspect we may have seen the low for the year in retail gasoline prices.
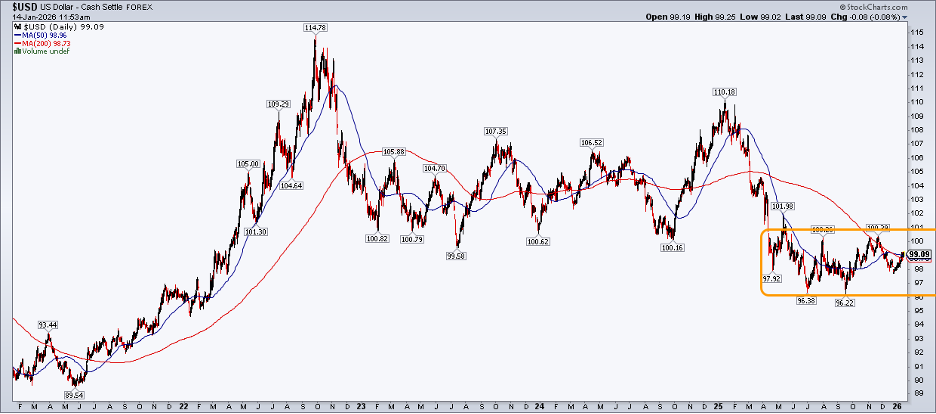
Weather Report: The Dollar Doesn’t Change the Game
No commodities or oil assessment is complete without a nod to the dollar — it’s sort of like the on-field weather conditions. Put bluntly, I don’t think the dollar matters very much for commodities right now. I’m taking a knee on this one. The DBC breakout comes as the U.S. Dollar Index (USD) has been dead flat since last July.
So, whether it breaks out or breaks down, I really don’t care very much. We’ll let the play unfold in front of us regarding currency swings. The dollar could be about to dust itself off — a bullish golden cross pattern occurred on December 19.
The Bottom Line
It’s X’s over O’s in commodities right now. The bulls are putting points on the board, while the bears are on their back foot. I see more DBC upside ahead, and oil’s advance will be critical to the trade in 2026.
Disclaimer: This blog is for educational purposes only and should not be construed as financial advice. The ideas and strategies should never be used without first assessing your own personal and financial situation, or without consulting a financial professional.


