Discretionary vs. Staples: Why ETFs are Flashing a Bullish Signal for 2025

Key Takeaways
- Key ratio charts help traders determine signal from noise.
- Consumer Discretionary versus Consumer Staples is a go-to relative chart to get a sense of investors’ risk appetite.
- Relative strength is not confined to US large caps.
Consumer Discretionary stocks are sending a powerful message in 2025. Amazon (AMZN) and Tesla (TSLA) account for nearly 40% of the Consumer Discretionary Select Sector SPDR ETF (XLY). That makes both fundamental and technical analysis sketchy if you’re trying to get a true gauge of what’s among the most cyclical and risk-on sectors in the US stock market.
Of course, there’s an easy solution, which is to check out the equal-weight version of Discretionary. For that, we can refer to the Invesco S&P 500 Equal Weight Consumer Discretionary ETF (RSPD). Up almost 10% so far this year, it looks solid. But we can dig even deeper into consumer stocks.
The Invesco S&P SmallCap Consumer Discretionary ETF (PSCD), as you might imagine, has underperformed its large-cap peers. Higher by 4% in 2025, small Consumer Discretionary names have performed closer to the S&P SmallCap 600 and Russell 2000.
Technicians know that there’s a world of stocks to consider, though. For that, I like to inspect price action in the iShares Global Consumer Discretionary ETF (RXI). Although it’s not heavily traded and AUM is paltry, we can still gain insight from this portfolio. It’s holding its own, with an 8% YTD advance.
Those are three Consumer Discretionary ETFs that readers may not be all that familiar with. Viewing them on their own is certainly helpful, but broader clues on the macro can be gleaned from comparing them to Consumer Staples products. Let’s roll through four of them – the market tell will be obvious by the time we're done.
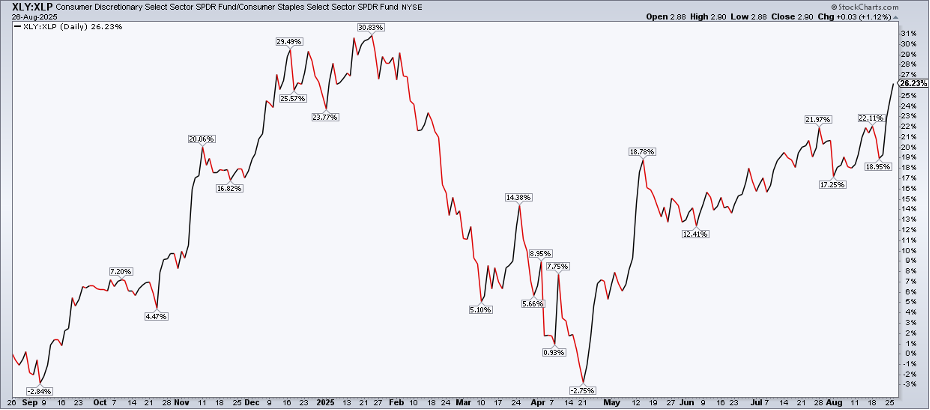
Firstly, the tried-and-true XLY versus the Consumer Staples Select Sector SPDR ETF (XLP) performance chart is quite encouraging. The ratio graph (which is the best format for determining relative strength between two securities) is now at fresh highs dating back to early February.
To be clear, these are two cap-weighted funds. AMZN and TSLA dominate the ETF in the numerator, and the likes of Costco (COST), Walmart (WMT), and Procter & Gamble (PG) are significant positions in the denominator fund. Still, XLY:XLP falls in the “bullish” category if you’re a diversified investor.
US Large-Cap Discretionary vs. US Large-Cap Staples: Highest Since February 2025
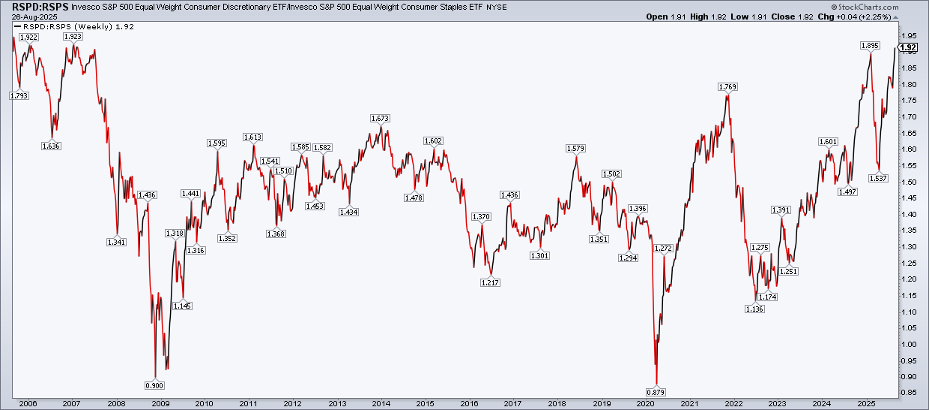
To back out the arguable, though natural, distortion of the cap-weighted funds, let’s hop over to the equal-weight suite. The portfolio construction may be different, but the technical message is the same: risk-on. In fact, this relative performance chart is even more impressive.
RSPD versus the Invesco S&P 500 Equal Weight Consumer Staples ETF (RSPS) may be poised to close August at its best level, going all the way back to before the GFC. The rally in just the last four months has been something to behold — a major V-bottom.
S&P 500 Equal-Weight Discretionary vs. S&P 500 Equal-Weight Staples: Highest Since 2007
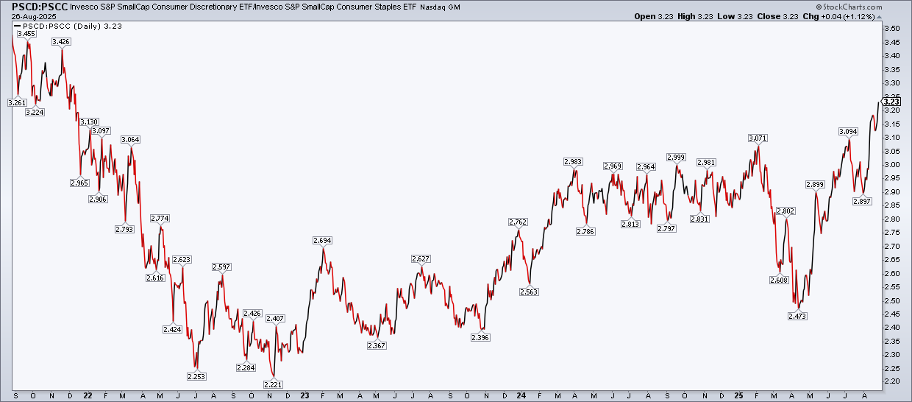
What about small caps? More positive signs. PSCD to the Invesco S&P SmallCap Consumer Staples ETF (PSCC) chart is another win for the bulls. Now at the best level since December of 2022, small-cap investors surely hope PSCD’s alpha is a harbinger of a new peak in either the Small-Cap 600 or the Russell 2000.
For the US market writ large, we are closing in on four years since the “little guys” celebrated their last all-time high. It might be time to ready your party favors.
US Small-Cap Discretionary vs. US Small-Cap Staples: Highest Since Early 2022
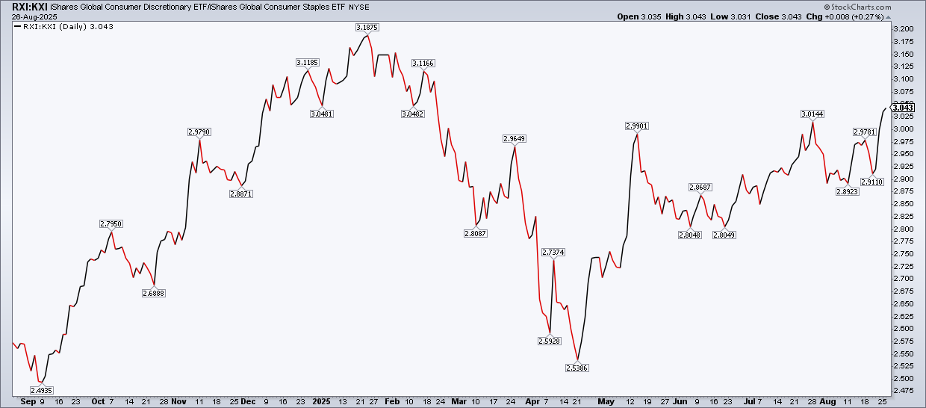
Now, let’s do some globe-trotting. Spoiler alert: Discretionary stocks are crushing Staples equities outside the States, too. RXI has rallied to a six-month high compared to the iShares Global Consumer Staples ETF (KXI).
Now, RXI and KXI are not pure ex-US portfolios. They are global, so a chunk of each’s holdings is domestic shares. Let’s not split hairs, though. It’s apparent that the trend of Discretionary over Staples is not just from AMZN and TSLA.
Global Discretionary vs. Global Staples: Highest Since February 2025
Bigger picture, global cyclicals versus global defensives are likewise at a multi-month peak. Along with Financials notching a new all-time high this week and credit spreads that remain very compressed, internal market clues lean bullish.
I would also encourage traders to keep tabs on StockCharts’ Key Ratios. And, if you aren’t intimidated by an inundation of relative performance data, you must bookmark the “Ultimate S&P 500 Chart,” a sort of secret-menu item that can keep you a step ahead.
Finally, I’d call out that XLY actually has a positive average September return in the last 20 years, while Staples is slightly negative. Thus, the September scaries, which plague many niches of the equity market, are not as applicable to Discretionary versus Staples.
The Bottom Line
Trading is often a sport of offense versus defense. When multiple indicators show the same thing, investors must take notice. The above set of Discretionary versus Staples ratio charts underscores underlying risk-on activity and momentum that spans market cap sizes and geographies. This is just one chart weapon in your arsenal, but it’s a valuable (and currently bullish) one.
Disclaimer: This blog is for educational purposes only and should not be construed as financial advice. The ideas and strategies should never be used without first assessing your own personal and financial situation, or without consulting a financial professional.


