Crypto’s Groundhog Day: Why Bitcoin Keeps Selling Off Despite a Risk-On World

Key Takeaways
- Bitcoin continues trading like a highly volatile and speculative asset, not a hedge against macro uncertainty.
- Chart clues suggest crypto’s volatility cycle remains unresolved despite broader market strength since last April.
- Key chart levels will determine whether recent weakness marks exhaustion or something more structural.
It sure felt like Groundhog Day for crypto investors. Bitcoin, Ethereum, and the like plunged over the weekend, following cascading selling pressure across the precious metals space to close out January. So far in 2026, Bitcoin is down 11%, while Ether is off 23%.
Zoom out a year and the pair of digital assets has declined 20%, all while global equities have zoomed to record highs. Inflation has been well above the Fed’s 2% target, mind you.
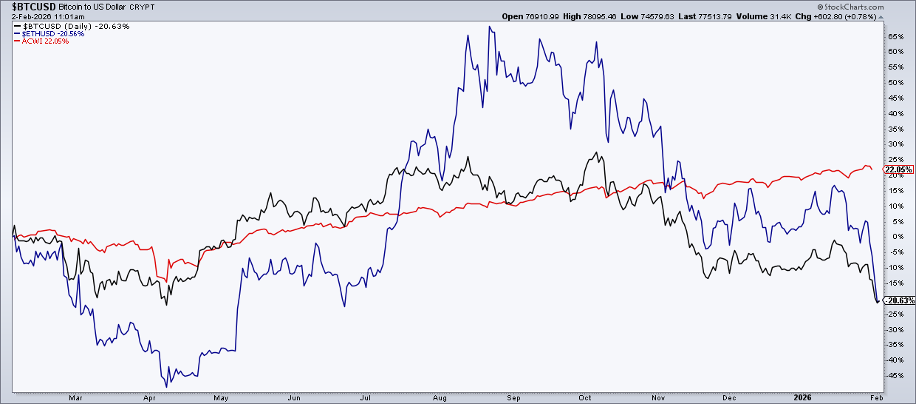
This raises several questions for crypto investors. Front and center, it’s clear that Bitcoin and its higher-beta alt-coin counterparts are just about the most risk-on plays a trader can make. By no means have they been perceived as safety plays when geopolitical tensions creep up. Quite the opposite, in fact. When will that change? Will it ever?
Furthermore, you’d think that the so-called “run-it-hot” economy would be primetime for Bitcoin to show off. Yet only the bears are impressed. Recall that $BTCUSD on your SharpCharts screen peaked on October 6, 2025, in the early-to-mid-innings of the Federal Reserve’s resumed cutting cycle. To be clear, crypto arguably led the way off the April low during that risk-on period, but its gains were cut short compared to the durable equity rally.
From a more existential perspective, cryptocurrencies are hardly currencies in the traditional sense. They are not a medium of exchange to any significant degree, nor are they a stable store of value. As for a unit of account, you might get queasy measuring your net worth or a business’s value with Bitcoin, Ethereum, or some meme coin.
To be fair, cryptocurrencies have routinely endured intense drawdowns. Bitcoin’s current 38% peak-to-trough decline appears tame by historical standards. It dropped 93% in 2011, 79% from late 2013 to early 2015, 78% from late 2017 to late 2018, 53% over a few months in mid-2021, and 76% during the 2022 bear market. Conversely, today’s perhaps more mainstream (even institutional) investors had expected widespread adoption and asset-class maturity to result in lower volatility and softer drawdowns; the next few months could prove that thesis wrong.
The $1.5 trillion digital asset is now about the same market-cap value as Tesla (TSLA), Meta Platforms (META), and Broadcom (AVGO). It’s a twentieth the size of gold. Does it matter to the global market? A little bit, but it’s not a make-or-break piece.
There are many debates, many questions, many factoids. But for clues on the current price outlook, we must rely on the charts. The YTD high was $97,900, notched on January 14. Since then, Bitcoin has plunged 24% to a low of $74,600 (as of this writing).
Recall that, in November, I noted a $75,000 technical target on $BTCUSD. A broadening top formation (also known as a megaphone pattern) had developed from Q3 into Q4; Bitcoin quickly pulled back to $80,600, within 10% of the price objective. From there, a classic corrective upside reversal ensued.
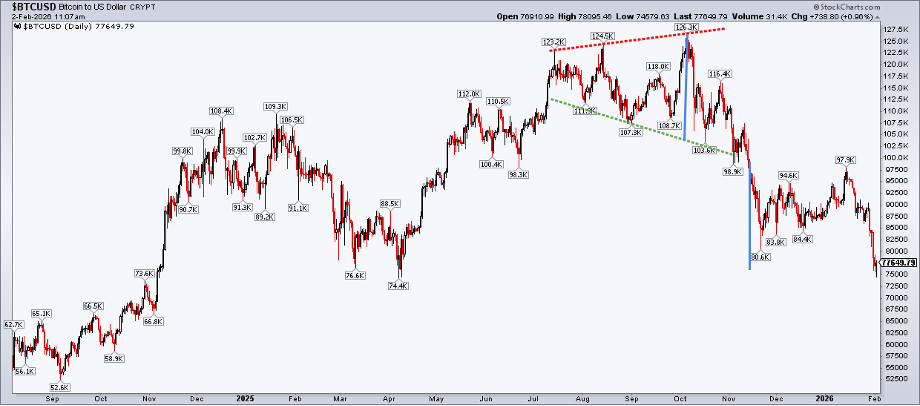
Notice in the chart below that Bitcoin retraced almost precisely 38.2% of the slide from the October record high (the top of the megaphone, and when many risk-on niches arguably topped, like private credit) to the November low. The bears were champing at the bit at the $97,900 Fibonacci price point.
At the time, the long-term 200-day moving average was already rolling over, despite a solid RSI trend. A bearish death cross, in which the short-term 50-day moving average moves below the 200-day moving average, occurred in November as well.
Bitcoin tagged the April 2025 low with near-perfect precision at the start of February. Technicians are naturally skeptical when so many market participants eye a single spot on the chart. As famed (turned infamous) trader Jesse Livermore quipped, “The stock market is never obvious. It is designed to fool most people, most of the time.”
Will it make a perfect double bottom to end the current bearish trend? Maybe. But perhaps we should consider other possible outcomes.
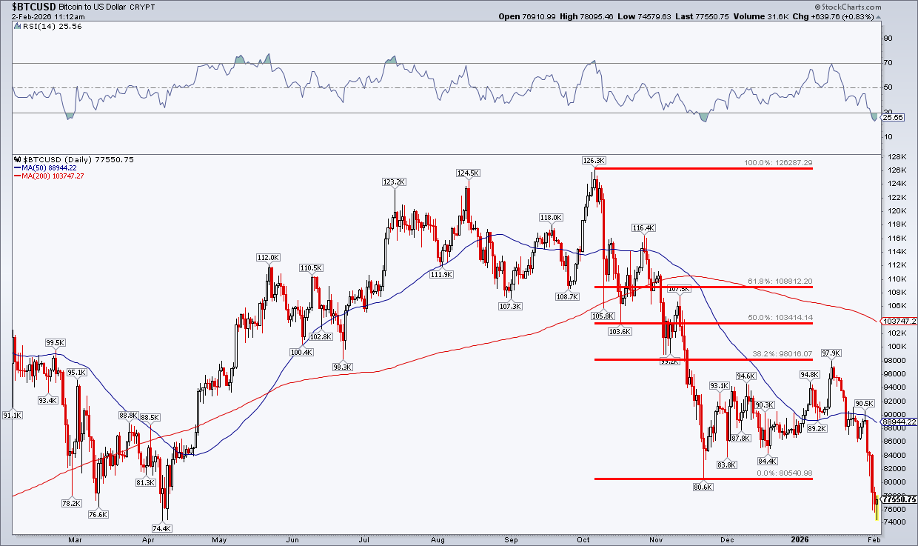
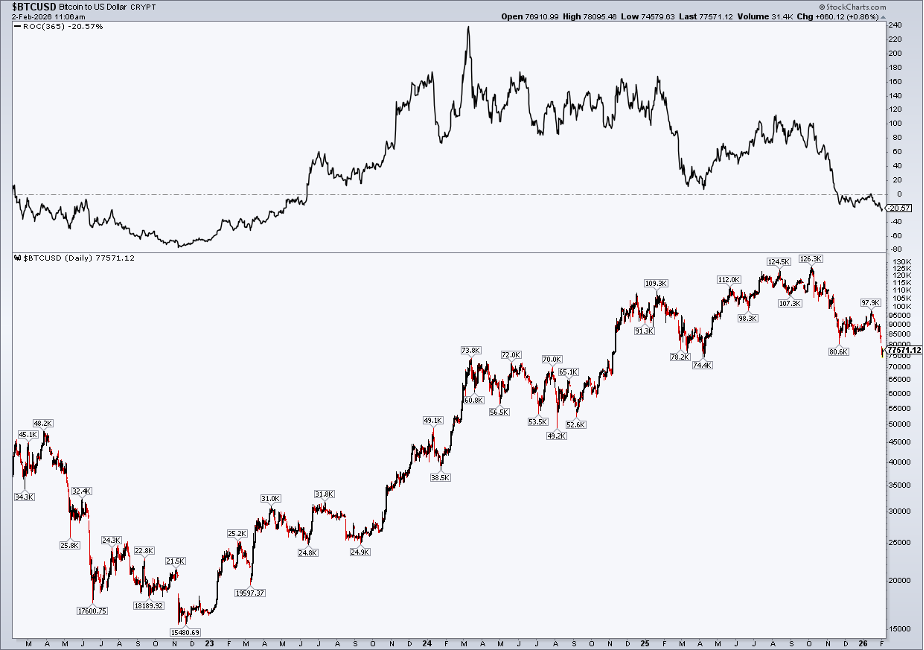
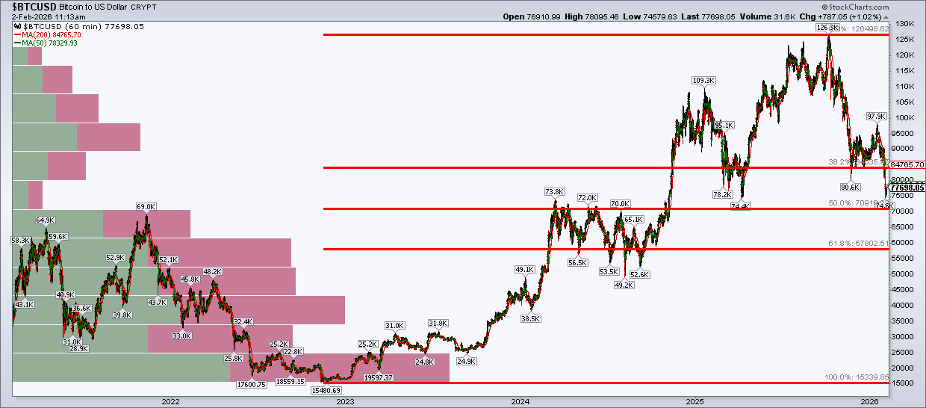
A truly gut-wrenching scenario would be if Bitcoin plunged to another, longer-term Fibonacci level. $58,000 is the 61.8% retracement of the entire 2022 to 2026 advance, so a fall to that spot would represent a 46% decline from high to low, making Bitcoin cheaper than it was about five years ago. Many towels would surely be thrown in by then. Such a downswing would bring bitcoin into a long-term congestion area, where a decent amount of previously traded volume could offer long-term support.
On the upside, the $95,000 to $100,000 zone has proven to be a tough battleground. Hurdling above it would be a tall ask, but an obvious prerequisite to revisiting the highs from just a handful of months ago.
The Bottom Line
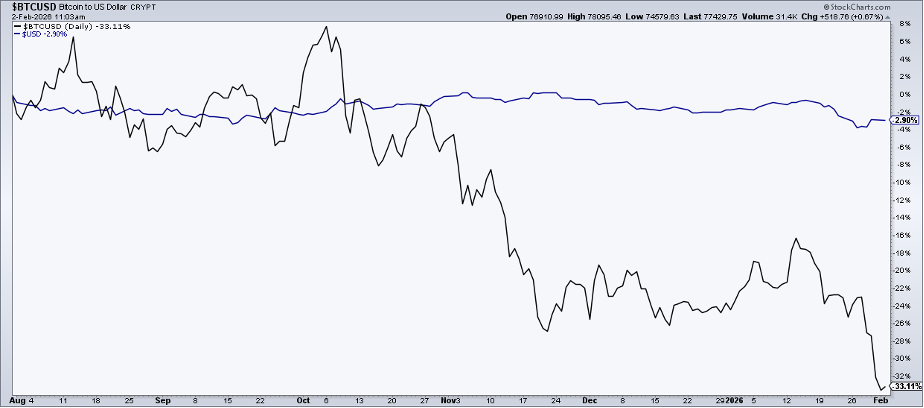
“Sell America” took a pause last week as US stocks turned a bit of a corner relative to ex-US markets, all while the greenback caught a bid after being deeply oversold. Then the “debasement trade” lost some steam, with precious metals getting walloped on January’s final trading day.
The turn of the month was brutal for beaten-down cryptocurrencies. A Bitcoin double bottom is possible, but traders must keep an open mind to other price-action outcomes.
Disclaimer: This blog is for educational purposes only and should not be construed as financial advice. The ideas and strategies should never be used without first assessing your own personal and financial situation, or without consulting a financial professional.