Emerging Markets Are Crushing the S&P 500: Is the Rally Just Beginning?

Key Takeaways
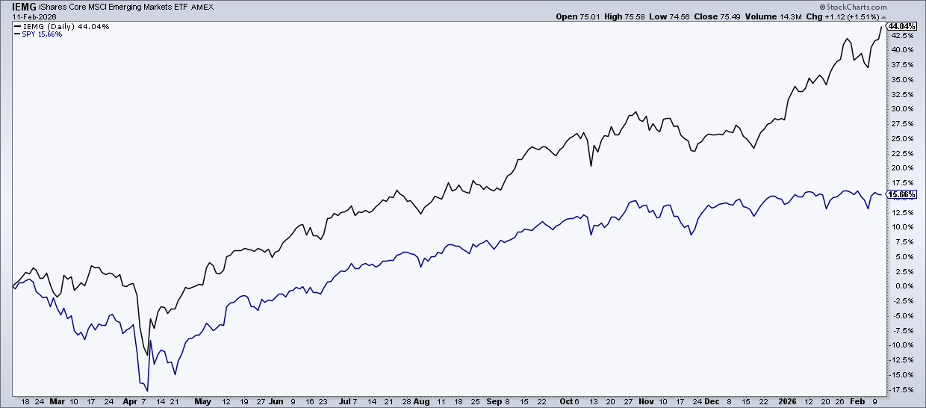
- IEMG is up 44% YoY, tripling the S&P 500’s gain while breaking above multi-year resistance.
- Technical targets in the high $80s to upper $90s suggest the IEMG breakout may have further to run.
- Dollar weakness has helped, but broad country leadership and strong relative strength tell a bigger story.
The raging bull markets in Japan and Europe garner plenty of fanfare. A pro-growth, pro-stimulus financial authority in Japan and increased defense spending across the Euro Area are clear tailwinds which weren’t seen just a handful of years ago. What’s more, the dollar’s giveback has allowed other developed markets beyond U.S. borders to spring to life after a decade-and-a-half doldrum period.
You can own it all through a basic, low-cost EAFE ETF. But that’s not what I’m focusing on today. Instead, I want to talk about the developed markets’ dangerous younger sibling: emerging markets.
A Simple Way to Own the World
You might own something like the Vanguard or iShares Emerging Markets ETF (VWO or EEM) as a long-term core position. (If you hold EEM, you may want to swap it out for its much lower-cost peer, IEMG.) Dusting off the early- to mid-2000s playbook, emerging markets led amid a then-cratering U.S. Dollar Index ($USD), soaring oil prices, and a true dash for diversification among global investors who had only recently gained easy access to EM funds.
EEM remains the primary ETF bandied about on financial social media, but IEMG is five times its size. So, let’s inspect the latter’s technicals.
Having returned 44% in the past 12 months, the so-called “BRICS” nations (sans the “R” these days) and beyond are on a real heater. The $145 billion index ETF has about tripled the S&P 500 ETF’s (SPY) performance YoY, all while dropping less during the February 19–April 7, 2025, near-bear market. That’s absolute, relative, and risk-adjusted return excellence from emerging markets.
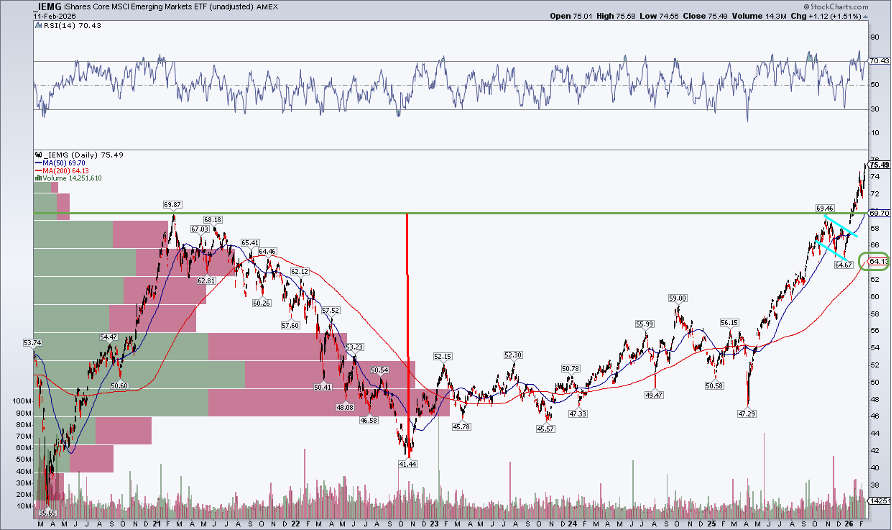
Notice in the chart below that IEMG only recently scaled its early-2021 peak just below the $70 mark. Back then, it plunged to a low of $41 amid the 2022 bear market. Today, less than 10% above the previous high, I assert that there may be much more room for EM to run. We can do basic measured-move analysis to calculate an upside price target.
The depth of the 2021–2022 decline and subsequent 2025 breakout yields a $28 range. Tack that onto the $70 breakout point and a ballpark $98 is assumed to be in play this cycle. Others may prefer a more-guarded 1.618% Fibonacci extension of the $41–$70 range, which gets IEMG to $87–$88. Either way, IEMG’s ascent appears to be far from over.
Seasonality: A Little Caution Near Term
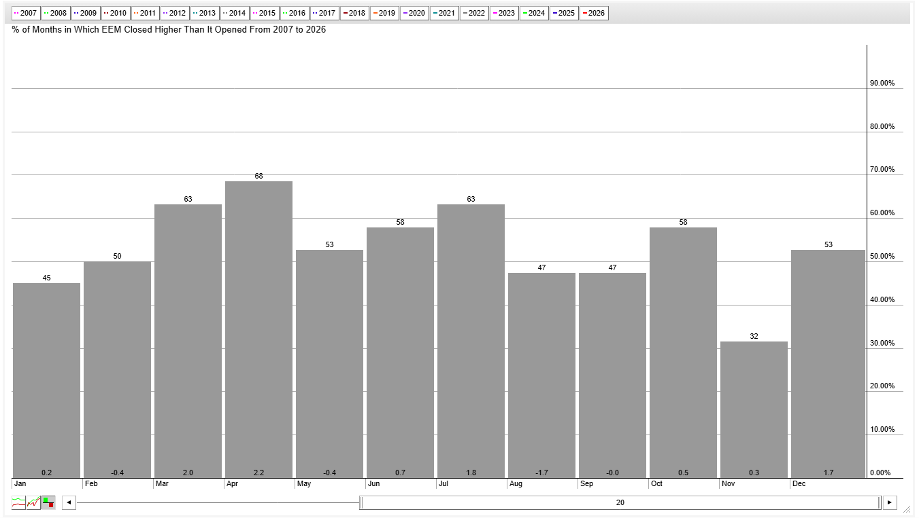
Old-fart bloggers like me on the financial Twittersphere have a soft spot for EEM, though. It’s also useful for its earlier inception date than IEMG’s. With price data going back 30 years, StockCharts’ Seasonality tool reveals that EEM’s 10% YTD gain just about matches its best performance out of the annual starting gates.
Some near-term caution may be warranted, as the mid-February through mid-March calendar stretch has been among the worst over the past 20 years, based on aggregated performance data.
But no matter which EM fund you choose (EEM, IEMG, VWO, SPEM, etc.), it’s clear that the bulls are steamrolling through a sometimes-skittish stretch. For EEM, February has been the second-weakest month over the past two decades, averaging a 0.4% decline and finishing higher in just half of all instances. That's not the case this time, though, as of yet.
Indeed, when price bucks historical trends, swing traders and active investors should take notice. If we get through the next few weeks unscathed, EM ETFs enter by far the most bullish period, from about St. Patrick’s Day through April.
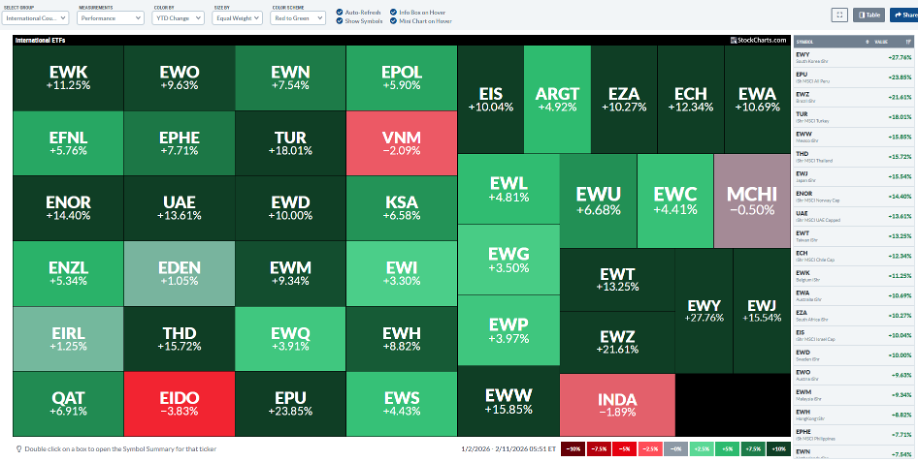
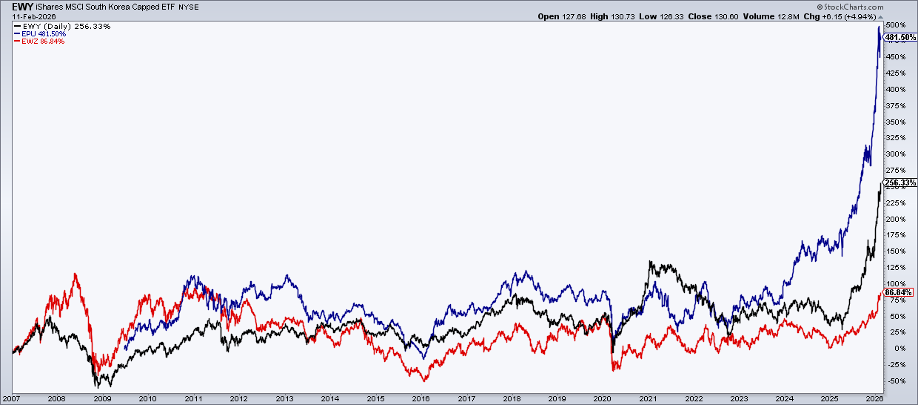
Bigger picture, “sell America” and the “debasement trade” capture plenty of media airtime. Narratives aside, among the 41 countries we track on the StockCharts International Country ETF performance MarketCarpet (heat map), just four are in the red thus far in 2026. Deeply green are some of last year’s winners, including the iShares South Korea ETF (EWY), iShares MSCI All Peru ETF (EPU), and the popular mid-2000s commodity play, iShares Brazil ETF (EWZ).
Leadership Is Expanding
These three emerging markets continue leading IEMG, and their rallies come after essentially zero returns from before the Great Financial Crisis through 2023. It’s difficult to believe that the bull run would be so short-lived as to end so soon.
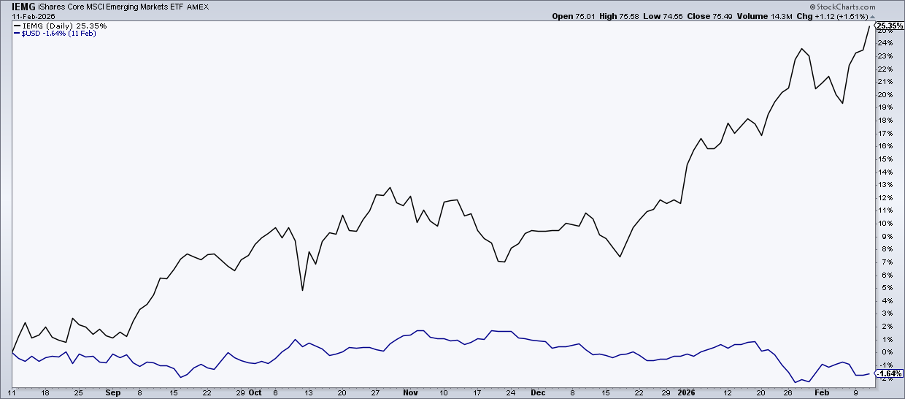
Now, critics might contend that EM’s gain is simply the result of the dollar’s pain. The math doesn’t agree. Since this time last year, the USD is down 10%. That explains just a fraction of IEMG’s 44% rally to record highs. Yes, a weaker greenback is a helpful macro condition, but it’s not the lone catalyst, nor is it even a prerequisite for EM outperformance.
Consider that over the past six months, the U.S. Dollar Index has hugged the flat line. IEMG? It’s up 25%. How about the past six years? Dollar flat; IEMG +68%.
Wrapping up, it's important to highlight what could go wrong. Long-time global investors are familiar with how EM trades can quickly go awry. Steeply rising U.S. interest rates could upend the bullish narrative, while a USD break above 100.50 could set in lasting currency headwinds.
A drop in commodity prices could hit South American stocks hard, while renewed tariff risks could slam Asian EM nations. Rather than guessing on those outcomes, pay attention to price action, both absolute and relative. For now, IEMG continues to lead the global pack.
The Bottom Line
For many investors, emerging markets are likely a small slice of their allocation. Almost two decades removed from EM’s heyday, the group has clearly found its stride again. IEMG is at record highs, posting stellar absolute numbers and an impressive Sharpe ratio over the past year.
Technicals suggest further upside, despite modest near-term calendar risks. Monitor interest rates, the dollar, and commodities with this global play. For now, it’s clear skies above.
Disclaimer: This blog is for educational purposes only and should not be construed as financial advice. The ideas and strategies should never be used without first assessing your own personal and financial situation, or without consulting a financial professional.


