The Final Diversification Frontier in Focus as Macro Jitters Front & Center

Key Takeaways
- SMIDs, commodities, and cyclicals make their mark as some leadership ebbs and others flow.
- Bitcoin, silver, and gold have posted strong early-year gains despite rising yields and a stronger dollar.
- Real Estate emerges as a stealth contender after years of alpha absence.
We are early into 2026, but trends emerge when scanning year-to-date absolute and risk-adjusted returns. It’s part of my weekend process — spotting what’s working and which areas lag across stocks, bonds, commodities, and currencies. And through the long holiday weekend, the Russell 2000 Index of small caps sticks out.
Rare to boast leadership, the market’s “little guys” are up in every session in January, with a perfect 11-for-11 daily track record. The same goes for U.S. microcaps, as measured by the iShares Micro-Cap ETF (IWC). Both index funds have soared to records, all while the S&P 500 wobbles just below the psychological 7000 mark.
I discussed strength in domestic mid-caps earlier this year, highlighting the broadening trade at home and overseas.
Sector Leadership Is Fragmented. and That Matters
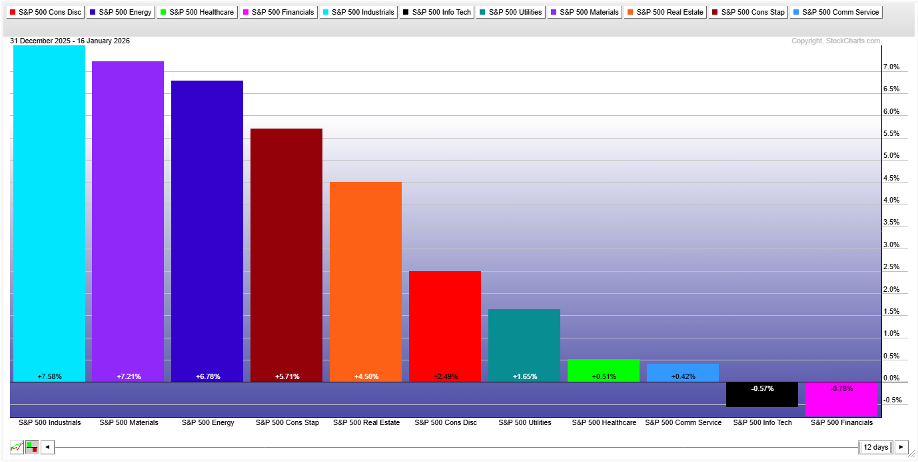
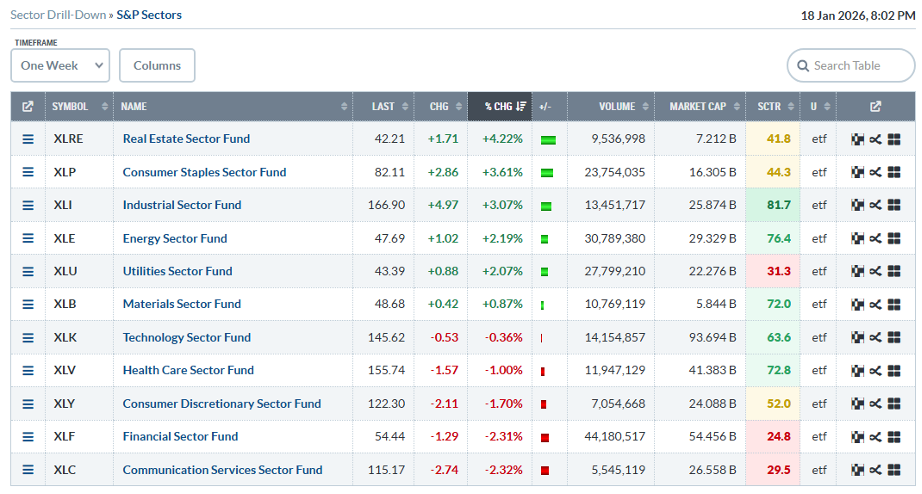
At the sector level, there’s no clear-cut leader. Rather, it’s a trio of cyclical/value niches. Industrials and Materials were up 7-8% as of Friday’s close, while Energy tracked close behind (+6.8%). Two quiet leaders, Consumer Staples and Real Estate, could be the dark horses to watch as earnings season broadens and the first quarter progresses.
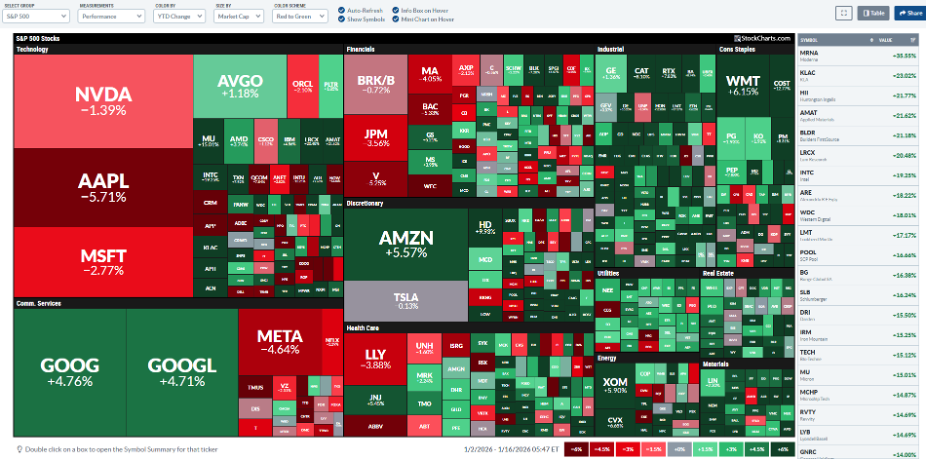
What may be most notable is what’s not helping the S&P 500 ascend through 7k. Information Technology and Financials rank Nos. 10 and 11 out of 11 in YTD performance. Of course, big-cap tech has been the undisputed leader throughout much of the AI-driven bull market, while Financials is routinely a top sellside bet, supported by a pickup in capital markets activity and a more favorable interest-rate backdrop. Yet five of the Mag 7 stocks are red in 2026 (illustrated above), while banks generally reacted poorly to last week’s Q4 reports.
Compounding weak nominal and relative returns, the Trump administration may be taking aim at credit card fees. Visa (V) and Mastercard (MA), among others, are sizable weights in the Financials sector.
Crypto, Rates, and Intermarket Signals
Elsewhere, before a Sunday night tumble, bitcoin was near the top of the performance stack, sporting a 9% advance. Even after meeting apparent resistance at $97,000, the world’s most valuable cryptocurrency is up a solid 6% with less than two weeks to go in January. Surprisingly, calendar returns are relatively uniform across all the big tokens, up 6-7% YTD.
As for bonds and commodities, all eyes remain on the 10-year yield and resistance just above the 4.2% mark. I’ve outlined that a breakout could lead to a fast advance toward 4.45%. For now, that may not necessarily be bearish for stocks. The S&P 500, and particularly U.S. SMIDs (seen as more rate-sensitive), have done just fine with yields creeping higher through the first half of January.
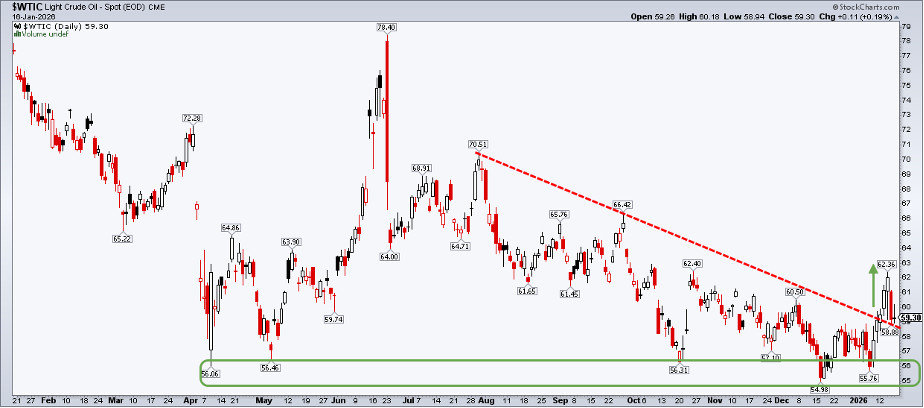
What’s more, the rising greenback (virtually straight up since December 23) has done little to pressure international equities. Oil, meanwhile, has the hallmarks of a breakout. A checkback to its previous downtrend resistance line could bring in buyers. Rallying oil and a backup in Treasury yields make sense from an intermarket perspective heading into what’s often a bullish seasonal period for black gold.
Precious Metals Refuse to Cool Off
And then there’s silver and gold. The new year can bring about some new trends, such as intense SMID-cap alpha and a bitcoin bounce-back, but other trends are so firmly entrenched that a mere flip of the calendar means nothing. Silver is +32% (its best start to a year on record), while gold is chugging along at all-time highs, +8% YTD. The “PGMs,” including palladium and platinum, are also shining with double-digit returns.
That’s the cross-asset story 2026 has written in the very early going. Diversified investors have won out, a 1% equity tariff-induced futures fall on the MLK holiday notwithstanding.
Get Your Magnifying Glass: Finding a 2026 Leader with Potential Upside
Now let’s play a little Where’s Waldo. Which corner of the investable universe mentioned above has been conspicuously quiet ever since the October 2022 bear-market low, but has also climbed the relative strength ladder? I’ll let you sift through the word salad for a moment.
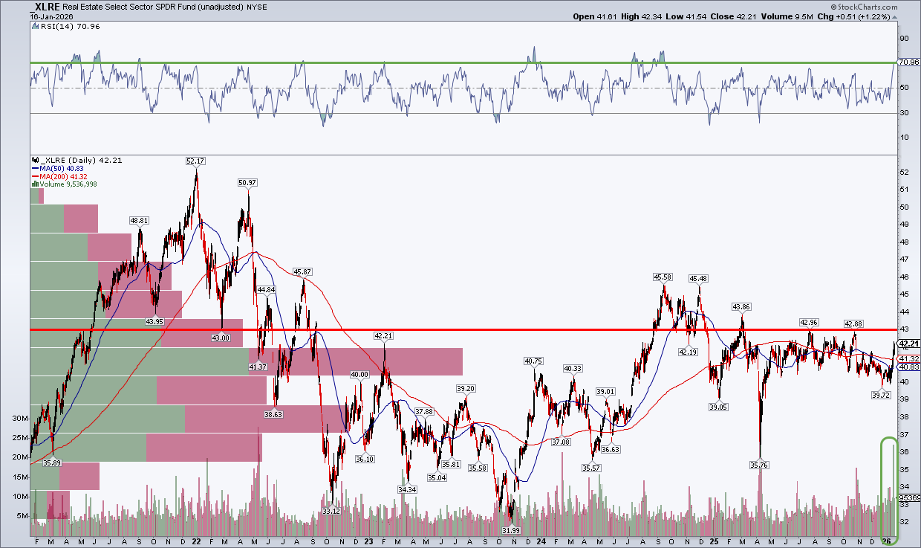
The answer is Real Estate, arguably the last of the major portfolio diversifiers not to make some kind of sustained run. In fact, shares of the Real Estate Select Sector SPDR ETF (XLRE) remain down from their late-2024 peak, even with dividends. The property space lags the S&P 500 ETF (SPY) by more than 60 percentage points since the October 2022 low. Based on the chart, I think a 2026 rally could be just beginning.
On the surface, XLRE’s technical view is not impressive. Notice in the chart below that its long-term 200-day moving average is declining, with the 50-DMA below it. What’s more, a series of lower highs and lower lows has been printed since Q3 2024.
But take a look at the RSI momentum oscillator at the top of the chart. It has soared to its best level since September ’24. Up in each session last week, XLRE’s advance came on significant volume, supporting the price move. Real Estate was best among the 11 S&P 500 sectors during the data- and earnings-heavy second full week of the year. Would you have guessed?
A breakout through $43 could quickly lead to a test of the $45.50 double top from 2024. It would also fit nicely with the broadening trade and the larger trend of portfolio diversification, paying proverbial and literal dividends as the bull market matures.
The Bottom Line
The new year has brought some new trends and more of the same in other areas. At the S&P 500 sector level, Real Estate stands out with a stealthy rally. It’s the last of the major portfolio diversification plays that has not yet broken out. A move through $43 would help build a solid foundation for the property slice of the U.S. stock market.
Disclaimer: This blog is for educational purposes only and should not be construed as financial advice. The ideas and strategies should never be used without first assessing your own personal and financial situation, or without consulting a financial professional.


