From Silver Frenzy to Sector Trends: What Markets Are Really Saying

Key Takeaways
- Precious metals volatility spike hints at meaningful positioning beneath the market’s quiet year-end surface
- Materials reach new highs, but its leadership remains narrow and heavily tied to precious metals
- Sector rankings reveal 2025 winners, laggards, and potential contrarian opportunities
It’s a sleepy time on Wall Street. That awkward stretch between Christmas and New Year’s is commonly marked by low volume on trading floors and consumer-interest stories (rather than price action) on financial TV.
But that doesn’t mean there isn’t any action happening under the market’s surface.
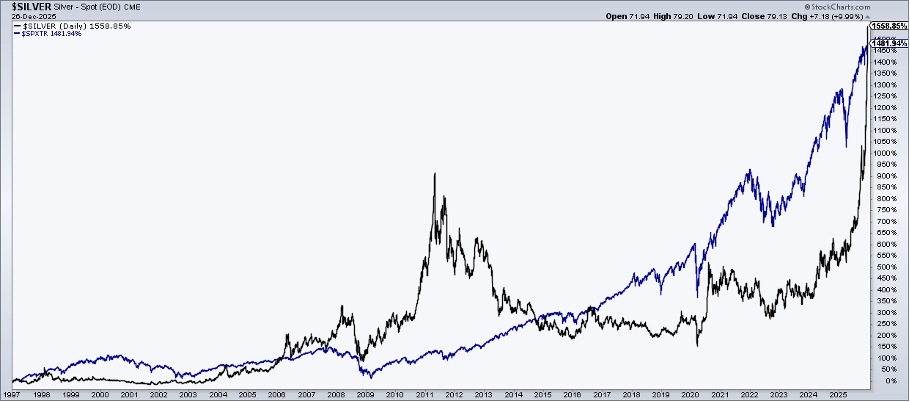
Yes, precious metals are the center of macro attention right now, particularly with skyrocketing volatility in silver and the “PGM metals” (platinum and palladium, among them). To finish off last week, options volume on the iShares Silver Trust (SLV) soared to a 52-week high, almost by a factor of two over its next most heavily traded session this year. Implied volatility on the gray metal was a lowly 23% in August. It’s near 80% today.
For all things options strategy, I encourage traders to check out StockCharts’ OptionsPlay Strategy Center.
Shifting Focus to Sector Trends
For now, I’m going to step off the roller-coaster ride that is precious metals and enjoy a trip down the lazier river of S&P 500 sector trends. To close out the final full trading week of 2025, just one SPX sector ETF notched a new YTD high: Materials (XLB). Alas, we can’t stray too far from the metals, I suppose!
Up 19.2% on the year (dividends included), XLB broke free from its tight correlation to the SPDR S&P 500 Trust ETF (SPY) back in August and September, right when gold and silver began their historic ascent. To get a clearer picture of what has worked best in the resource-rich niche of the global stock market, I pulled up the sector’s MarketCarpet. Here, we find that metals stocks have shown off.
Illustrated below, Newmont (NEM) is the major market-cap winner, up 83% in the past six months, while others like Agnico Eagle (AEM), Barrick (B), and Kinross Gold (KGC) have posted incredible gains over much of the second half (a steep October–early November correction notwithstanding).
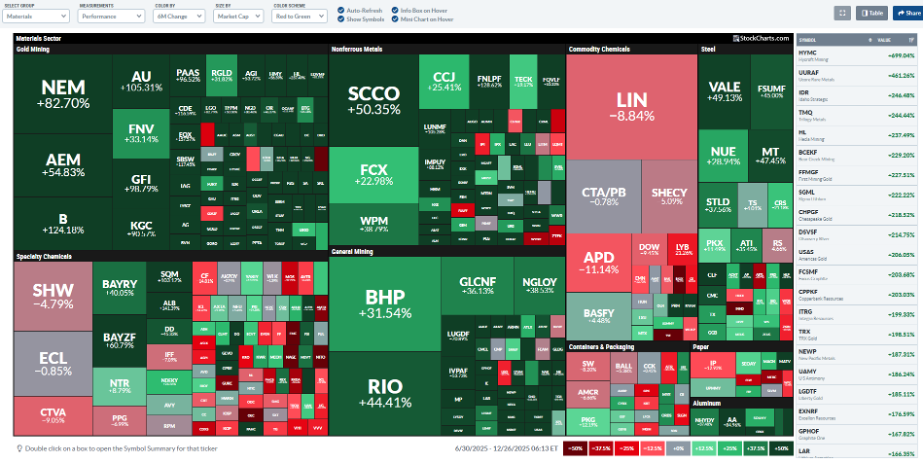
Materials Tape Not Entirely Painted Green
Breadth in Materials has not been deep, though. Gold mining stocks, nonferrous metals, and steel names largely shine, but Commodity Chemicals and Specialty Chemicals are stinking up the joint. Linde (LIN), Air Products (APD), and DJIA component Sherwin-Williams (SHW) have been in the red since late June.
What’s more, cyclically tied Containers & Packaging industry stocks’ relative weakness doesn’t augur well for the global macro economy in 2026. Domestically, recall that Sherwin-Williams announced a temporary suspension of its matching contributions to employee 401(k) plans due to weak sales at the turn of Q3 into Q4 — never a great sign.
Big Picture: Sector Performance in 2025
Zooming out, year-end is an ideal time to take stock of all 11 S&P 500 sectors. For this, I go back to my personally saved PerfChart. You too can create a library of your favorite StockCharts pages. Just click the “Permalink” icon or “Share” link whenever you see it (it’s available on most charts and pages across the site). Save it in your browser as you would any other bookmark.
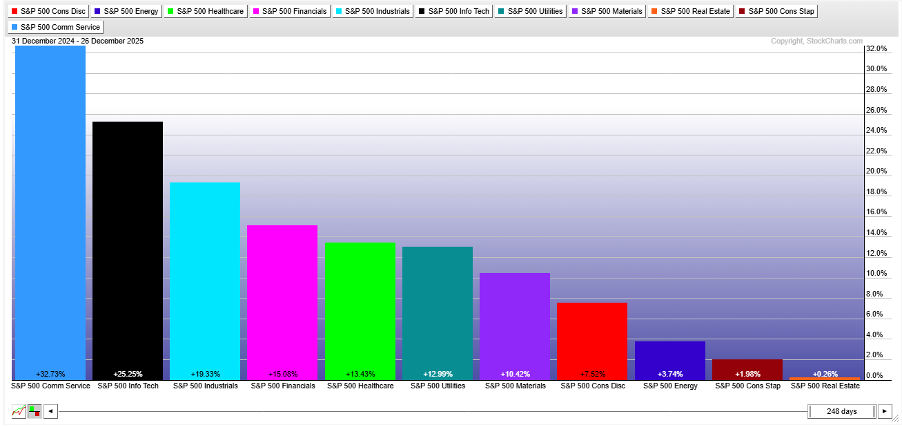
This PerfChart (shown below) sits near the top of my technical-analysis online library. The data show that Communication Services is set to take the 2025 crown, up 33% through 248 trading days. Information Technology is the runner-up at +25%. It’s not all about the “TMT” sectors, though; Industrials and Financials are up between 15–20%, performing roughly in line with the S&P 500 on a price-only basis.
Materials, despite XLB at a record level, has actually lagged the SPX. Additionally, three sectors are underperforming the aggregate bond market — Energy, Consumer Staples, and Real Estate. Just as the “Dogs of the Dow” strategy makes the rounds as the ball drops in Times Square on New Year’s Eve, value and contrarian investors may look to find diamonds in the rough among this triad of laggard sectors.
Index Weighting Matters
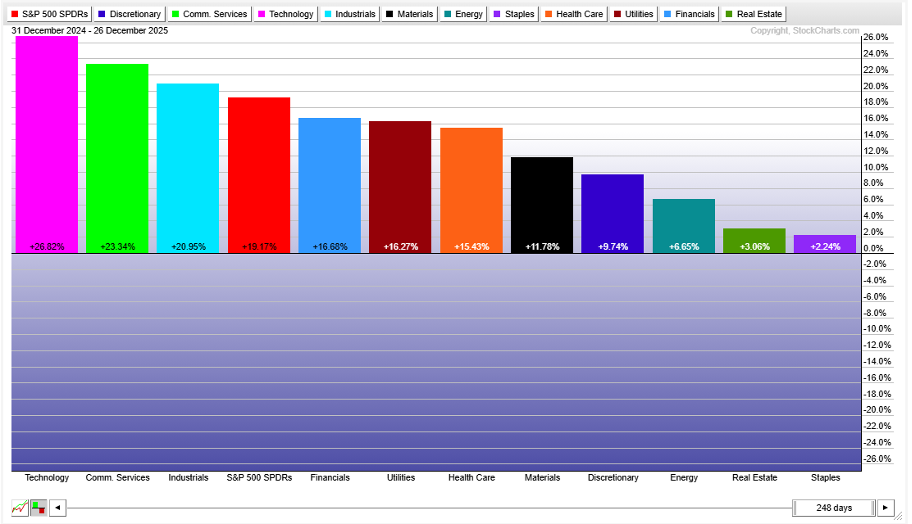
While I’m partial to my bookmarked sector-performance Permalink, traders can also take advantage of predefined PerfCharts groups. To do so, select S&P Sector ETFs in PerfCharts, toggle on the S&P 500 ETF, and then sort YTD by performance. You’ll notice a different lineup than the one shown earlier.
In this case, Information Technology (XLK) — not Communication Services (XLC) — is likely to claim the No. 1 spot. If you’re wondering why the ETF rankings don’t perfectly match the S&P 500 Index sectors, the answer lies in weighting and concentration limits (look up the 25/5/50 rule if you’re in the mood for some dull holiday reading).
The Bottom Line
Low volume, a low VIX, and small daily moves are common traits of the middle of the Santa Claus Rally period. If you’re a market junkie like me, there’s no better time to step back and gauge the price-action landscape.
Yes, tech and AI have reigned supreme since the middle of April, but there may be a new Magnificent Seven comprised of gold, silver, platinum, copper, palladium — and maybe we can toss in live cattle and feeder cattle. Materials is not a monolith, and I expect Wall Street’s focus to revert to AI and the consumer once folks return from the holidays next week.
Disclaimer: This blog is for educational purposes only and should not be construed as financial advice. The ideas and strategies should never be used without first assessing your own personal and financial situation, or without consulting a financial professional.


