How a Simple Scan Reveals Strength In a Weak Market

Key Takeaways
- While tech stocks have pulled back, other areas like Transports, value stocks, and select Industrials are showing strength.
- Key groups remain technically healthy, holding important support levels and maintaining healthy momentum.
- Using simple StockCharts scans helps identify stocks with improving momentum.
If you’ve been glued to the stock market, you’ve probably noted a shift. Tech stocks are selling off, Bitcoin has taken a huge hit, and precious metals continue to struggle.
Despite this weakness, not everything is struggling. There are some areas of the market that are doing well.
A Big Picture Check
Let’s start with the Market Summary page on StockCharts. Despite the recent volatility, each of the US indexes in the Equities panel is trading above its 200-day Simple Moving Average (SMA).
The shorter-term picture is a little more mixed. More indexes have slipped below their 50-day SMA and 20-day Exponential Moving Average (EMA), but one group stands out — the Dow Jones Transportation Average ($TRAN). We’re also seeing small-caps, mid-caps, Industrials, and value stocks holding up much better than the tech-heavy Nasdaq Composite ($COMPQ) and Nasdaq 100 ($NDX).
What this tells us is that the market is in rotation.
Asset Groups Gaining Attention
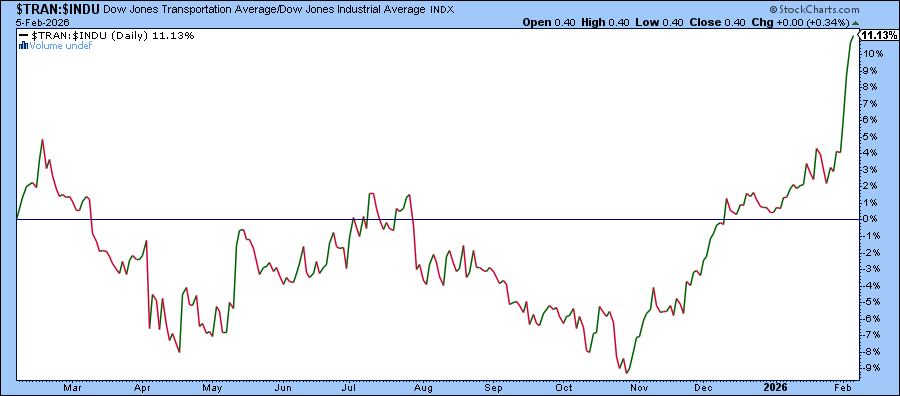
Transports are Riding High. The Dow Jones Transportation Average notched a record close on Wednesday. The chart below shows that over the last year, Dow Transports has outperformed the Industrials by 11.13%. This tells you that money is still being put to work.
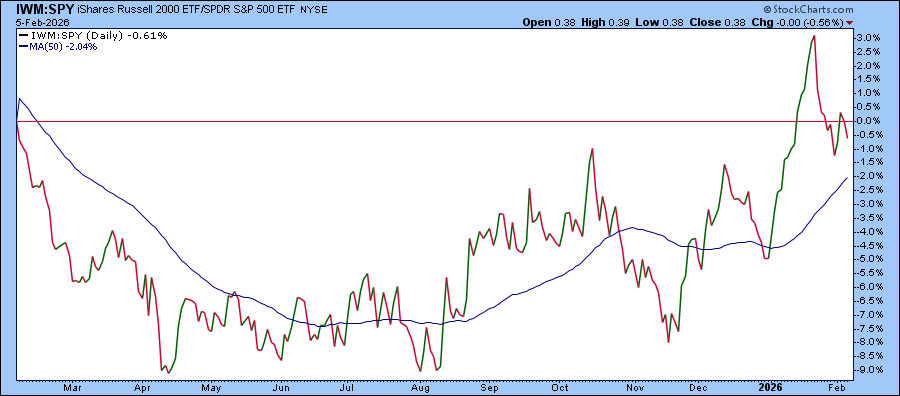
Small Caps are Holding Steady. Small caps aren’t leading, but they’re holding their ground. Over the last year, IWM underperformed SPY by just -0.61%. It may not sound like much but if you look at a longer-term weekly chart, you’ll see that small-caps are waking up after a long hibernation.
Value vs. Growth. Value stocks are starting to show strength. The iShares Russell 1000 Value (IWD) is outperforming its growth counterpart, iShares Russell 1000 Growth (IWF).
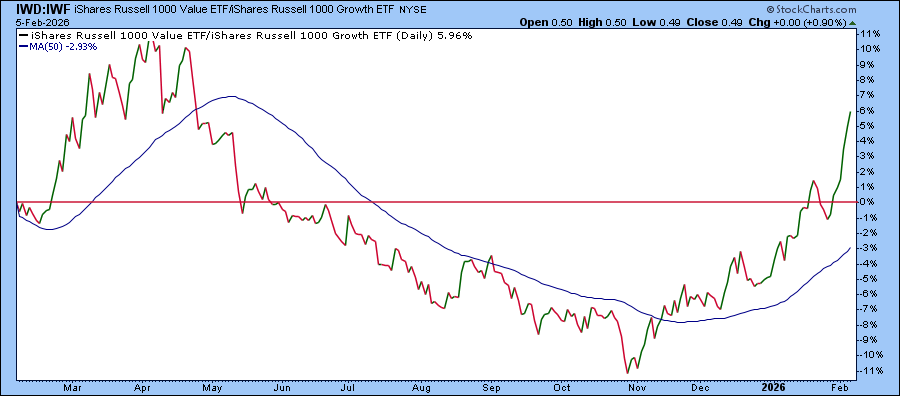
This is another sign of rotation rather than unloading equity positions.
Should You Chase Rotation?
Before abandoning tech stocks, it’s worth revisiting the Market Summary page and viewing the US Industries panel. Despite recent weakness, Semiconductors are still outperforming the S&P 500 by more than 40%.
Looking at the daily chart of XSD, the SPDR S&P Semiconductor ETF, we can see that it bounced off its 50-day SMA and momentum is relatively stable, with the Relative Strength Index (RSI) sitting just under 50.
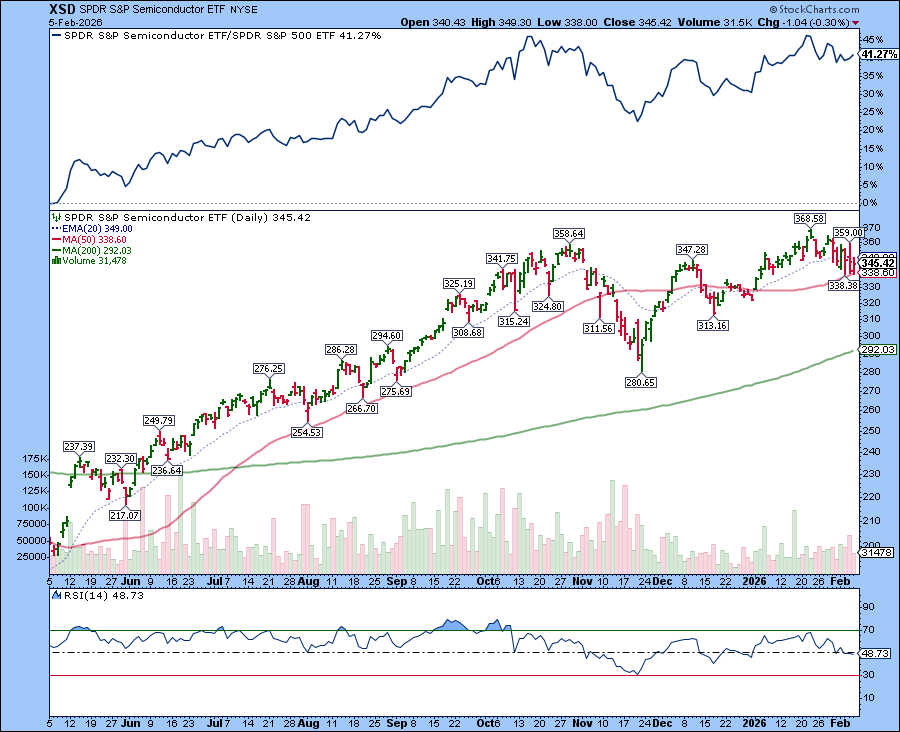
Unless semiconductors show meaningful deterioration, this pullback may be a reset. Software could be a different story but, broadly speaking, this looks like a pause after a strong run.
Finding Opportunities
So, does this mean it’s time to add large-cap growth stocks? This is where scanning shines.
Here’s a simple scan I ran using the StockCharts Scan Workbench. The goal was to find Nasdaq 100 tech stocks with positive momentum.
Scan criteria:
- Index Membership: Nasdaq 100
- Sector: Technology
- RSI (14): Greater than 50
How to Create the Scan
- Select the Scans & Alerts tab > Scan Workbench
- Clear all existing text.
- In the Scan Components panel, select the Key Properties tab.
- Security Type > Stock > click plus icon
- Index Membership > Nasdaq 100 > click plus icon
- Sector > Technology > click plus icon.
- Select the Technical Indicators tab.
- Technical Indicators > RSI > click plus icon.
- Modify the text for the RSI (in the Scan Criteria panel) to be greater than 50.
- Check Syntax > Run Scan
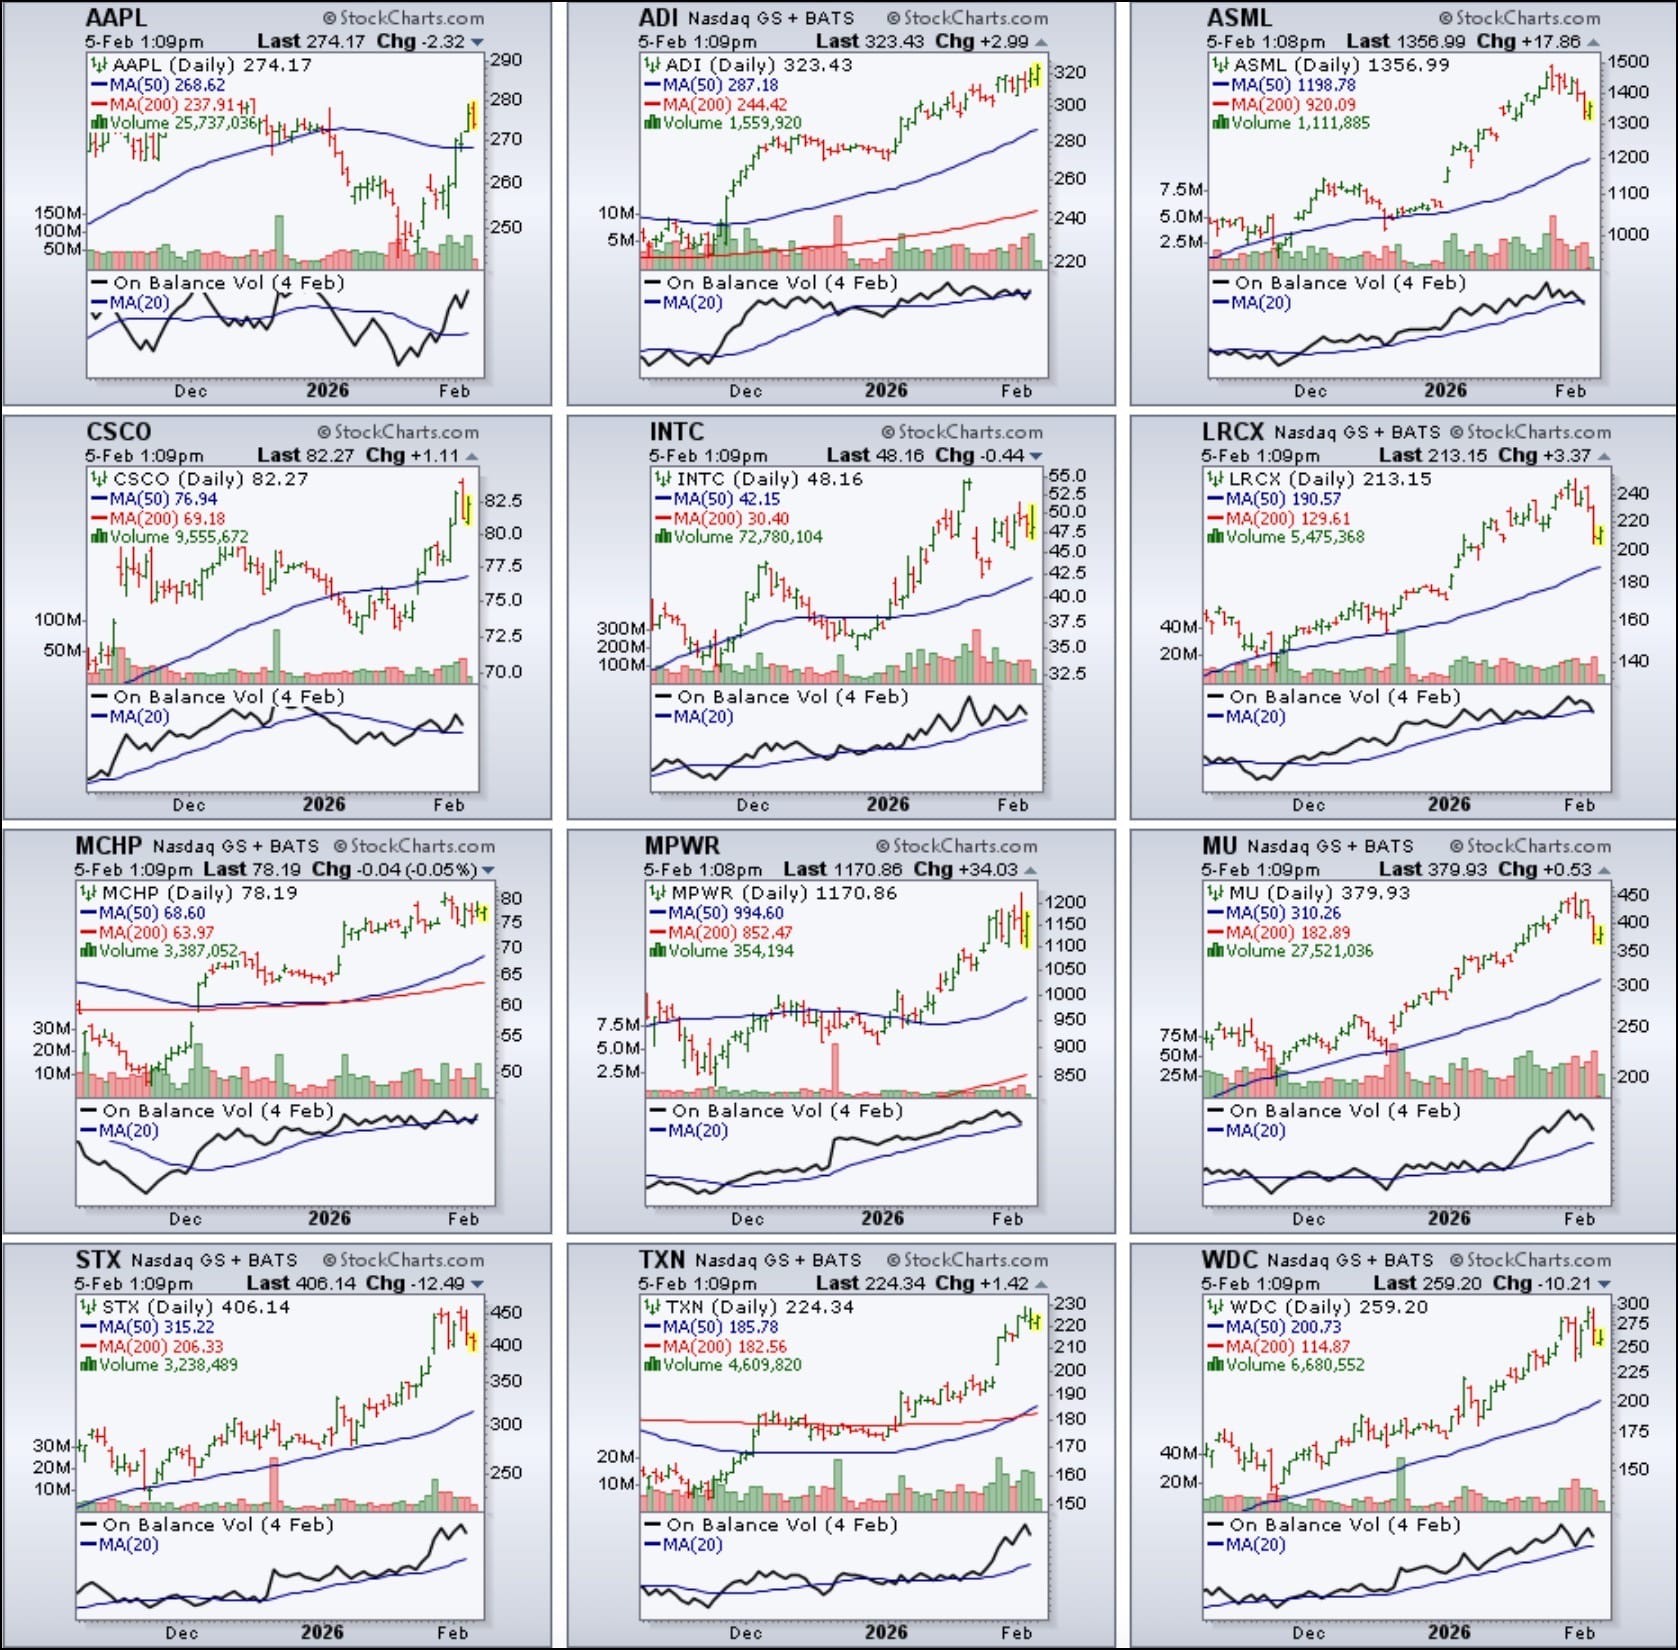
The Scan Result. 12 stocks, most with strong StockCharts Technical Rank (SCTR) scores. Several were semiconductor names.
Viewing the scan results in CandleGlance format makes it easy to spot trends at a glance. Notably, every stock in this group is still trading above its 50-day SMA.
So, perhaps there’s no need to sell tech and buy transports, or sell growth to own value. Markets rotate from time to time, and investors need to adapt. If you have some dry powder, it may be a chance to diversify into areas showing strength, add quality stocks on pullbacks, and use scans to stay objective and disciplined.
Try scanning similar scans on Transportation stocks or small-cap stocks that are gaining momentum. You’ll likely get a much longer list for small caps, so you may have to add additional scan components to narrow the list.
Want to Go Deeper?
If you’re new to the Scan workbench or want to see what’s new, check out our latest walkthrough video and see how powerful and simple scanning can be.
Disclaimer: This blog is for educational purposes only and should not be construed as financial advice. The ideas and strategies should never be used without first assessing your own personal and financial situation, or without consulting a financial professional.