How High is Too High for Gold?

There’s no denying that gold has been in a remarkable uptrend phase for the last six weeks. As a trend follower, my goal is to follow trends as long as possible. So we’ll review some of the technical analysis tools that can help define and track this relentless uptrend in the yellow metal.
But part of being a trend follower is acknowledging when the trends have actually reversed! So we’ll also go through some of the “red flags” that could indicate an end to the bullish run for gold.
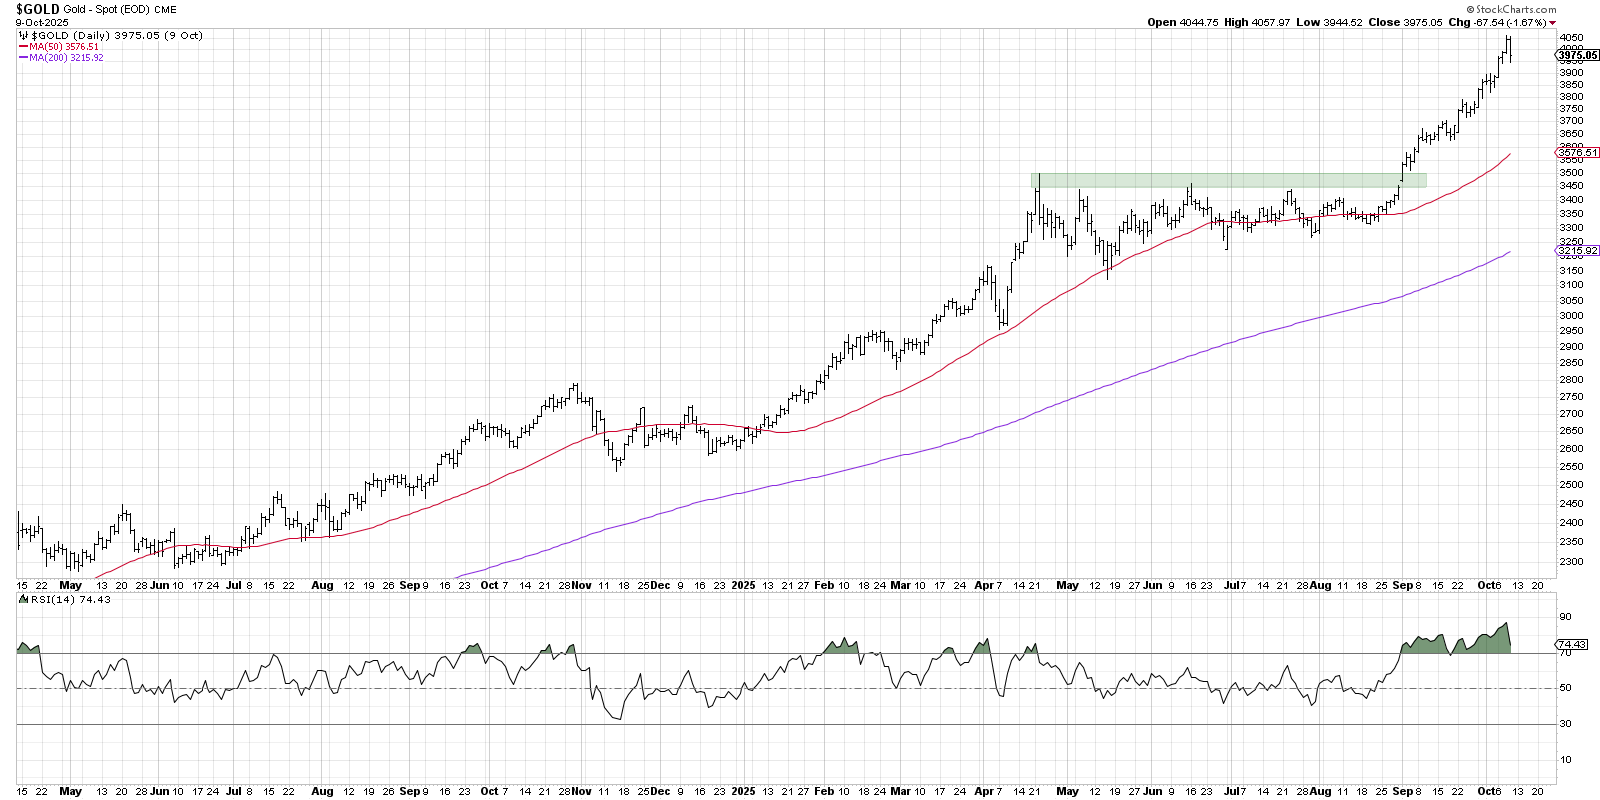
Gold has basically experienced three distinct phases so far in 2025. We started with the “bullish new year” phase from January through a mid-April peak around $3500, followed by a “mid-year consolidation” phase from the April peak through the end of August. Finally, a major breakout to new all-time highs ushered in the “bullish autumn” phase, which has propelled gold to reach $4000 for the first time in history.
Notice how the RSI has been overbought almost the entire time since that early September breakout? That demonstrates the strong upside momentum driving gold onward and ever upward. At this point, there are no warning signs in terms of a bearish momentum divergence, as the RSI has remained strong as gold has achieved new highs.
Now let’s review the chart of the SPDR Gold Shares (GLD), which tracks spot gold very closely over time. On this chart, we’re showing how the early September breakout is actually the latest upswing in a repeated pattern going back to early 2024.
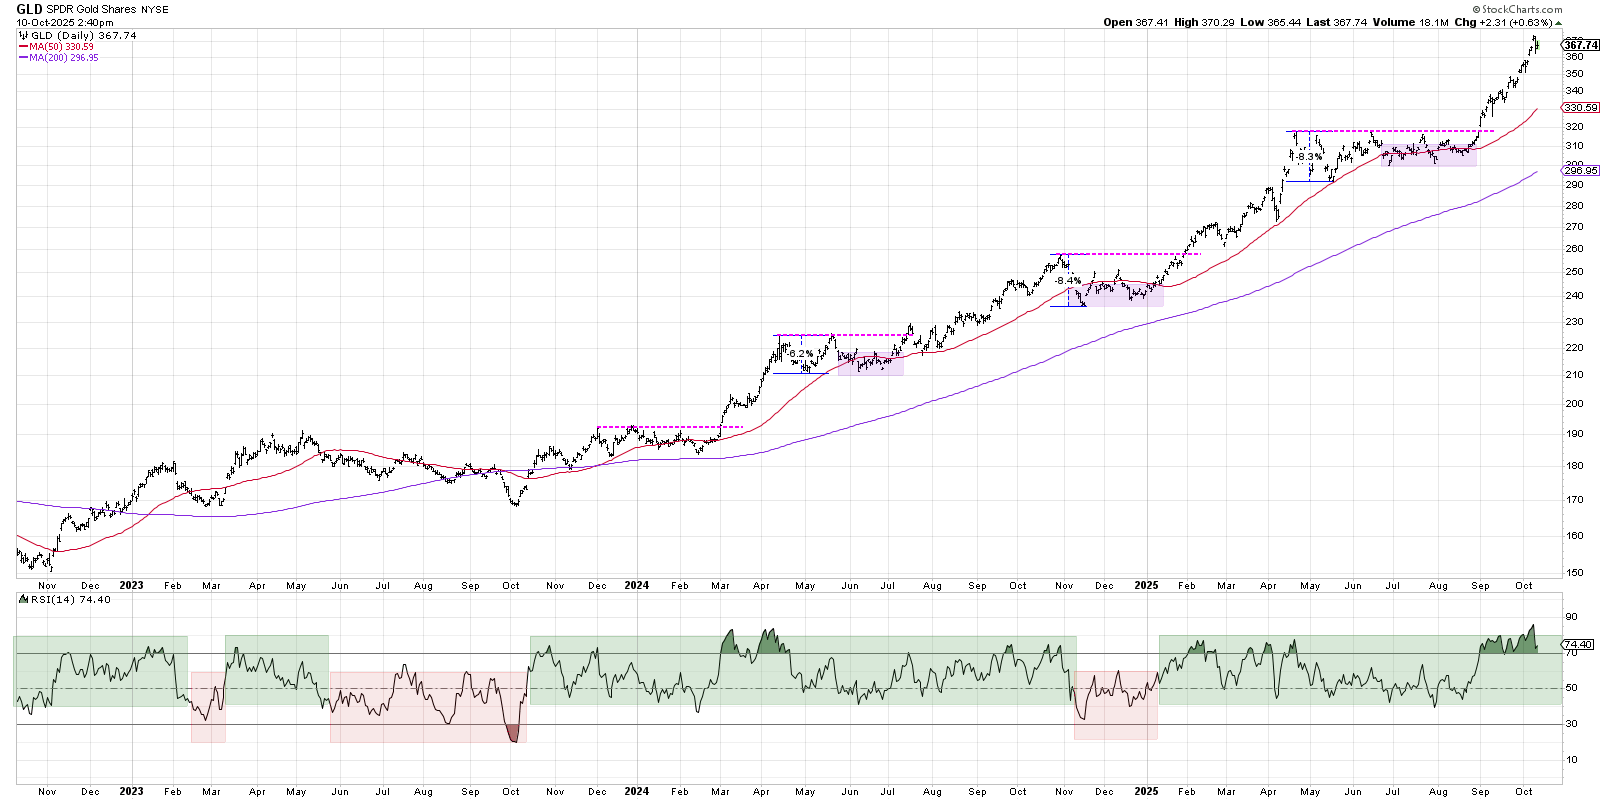
First, GLD makes a new swing high and remains overbought into the final peak. Then we see a pullback, usually in the 6–9% range, as the RSI pulls back to around 40. After spending time below the 50-day moving average, gold recovers higher, eventually breaking to a new swing high on stronger momentum readings.
Looking for help making sense of daily market action? Our daily market recap show, CHART THIS with Dave Keller, will help you recognize the most important movements from each trading session. Dave will also identify key stocks on the move using the StockCharts MarketCarpets and highlight actionable charts to watch. Tune in every trading day LIVE at 5 pm ET on the Market Misbehavior YouTube channel!
So even though gold has experienced frequent corrective moves over the past two years, they have been corrections more in terms of time than price. And while “this time could be different”, it’s helpful to recognize that a time correction in the near future would actually be quite normal based on the recent action in gold prices.
How does this intense uptrend for gold relate to the trends in other asset classes? First, we can check out the year-to-date returns for gold vs. stocks and other ETFs.
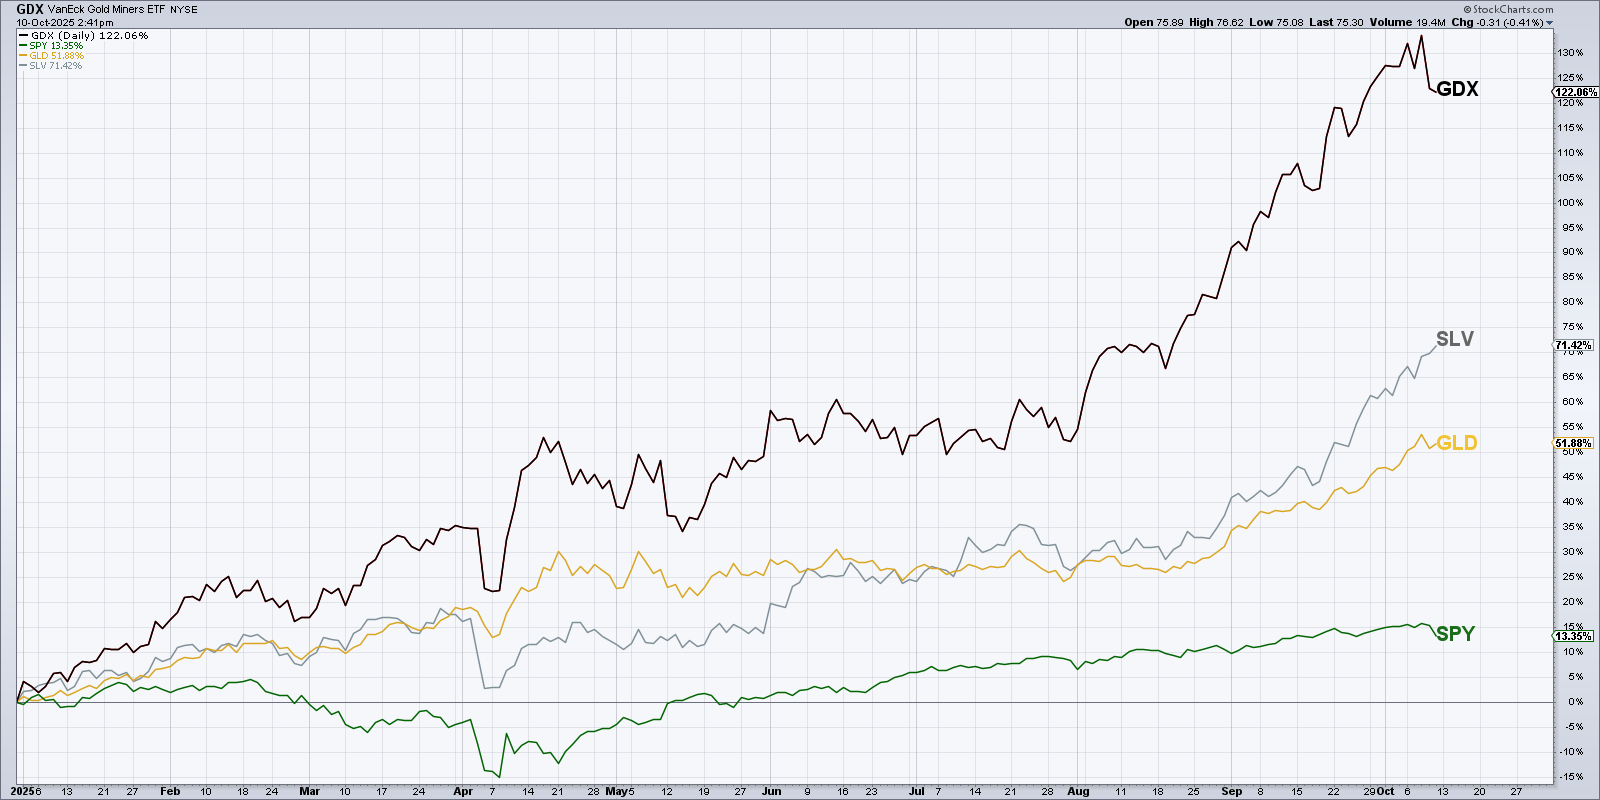
As of October 10th, the S&P 500 is up around 13.4% for the year. Gold is up around 52%, while the iShares Silver Trust (SLV) has gained around 72% year-to-date. But none of those returns come close to gold mining stocks, as demonstrated by the VanEck Gold Miners ETF (GDX) with its +122% reading so far in 2025.
Now growth stocks have been on a tear off the April 2025 market low, with semiconductors and other technology companies experiencing strong gains. How do gold stocks compare to the other industry groups?
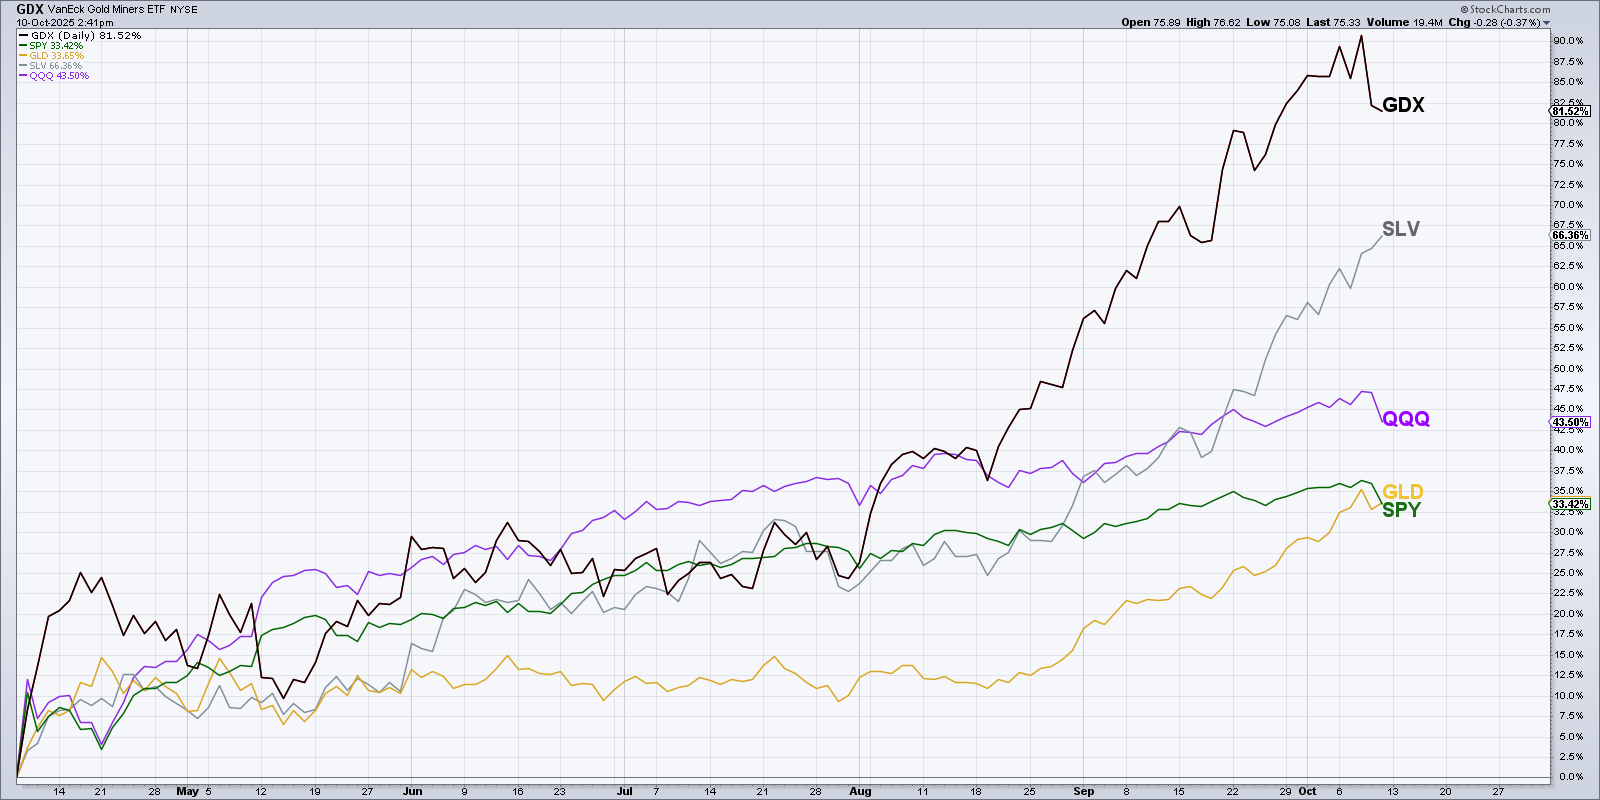
Since the April 2025 market low, we can see that gold and the S&P 500 have experienced almost identical returns, both up around 33%. The Nasdaq 100 (QQQ) is up about 43% since the April low, compared to +67% for silver and +81% for gold miners. So even the AI-fueled euphoria for technology has not overcome the strong uptrend in gold miners!
That brings us to the only gold stock listed as an S&P 500 member, Newmont Corporation (NEM). NEM actually completed a cup with handle pattern in June, followed by additional bullish action through early October. The RSI has recently come out of the overbought range as NEM is approaching our initial stop at the 21-day exponential moving average.
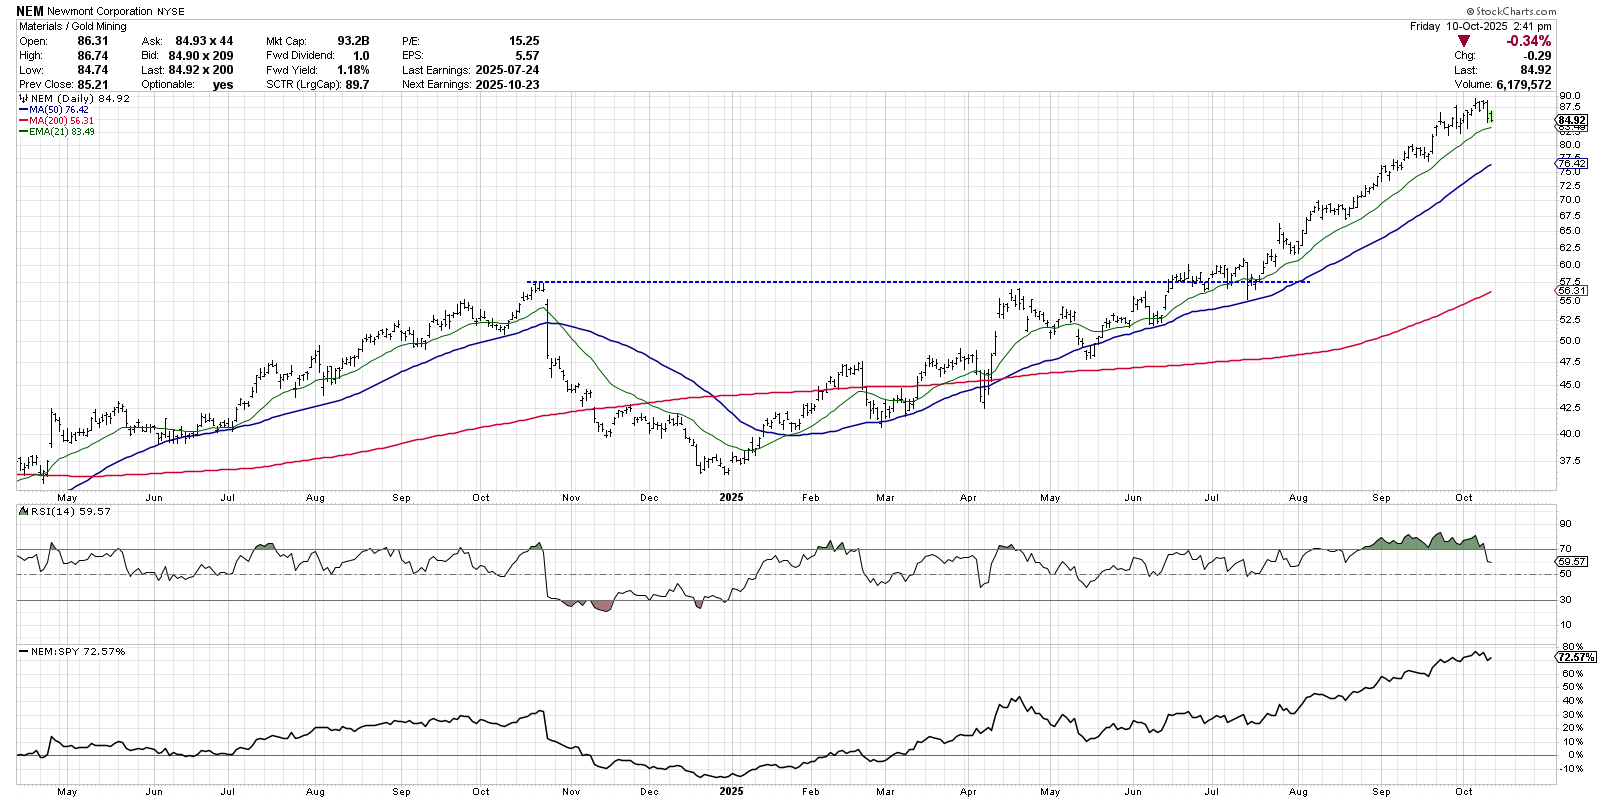
NEM has shown a number of tactical pullbacks since that June breakout, and all of them have found support at or around the 21-day EMA. If that initial stop would trigger, we’d be focused on the 50-day simple moving average, as well as the RSI. If the RSI can hold 40 on a pullback, then the long-term uptrend is most likely still secure.
RR#6,
Dave
P.S. Ready to upgrade your investment process? Check out my free behavioral investing course!
David Keller, CMT
President and Chief Strategist
Sierra Alpha Research
marketmisbehavior.com
https://www.youtube.com/c/MarketMisbehavior
Disclaimer: This blog is for educational purposes only and should not be construed as financial advice. The ideas and strategies should never be used without first assessing your own personal and financial situation, or without consulting a financial professional.
The author does not have a position in mentioned securities at the time of publication. Any opinions expressed herein are solely those of the author and do not in any way represent the views or opinions of any other person or entity.


