How to Trade the Q3 Earnings Wave: Delta, Pepsi, and the Banks

Key Takeaways
- Delta and Pepsi jumpstart the third-quarter reporting period, and the charts show some vulnerabilities.
- StockCharts’ earnings calendar shows a slew of bank earnings on tap next week.
- Big tech reports over October’s final days, with all eyes on sales and profit numbers as official government data remains on hold.
Amid a dearth of official data, investors can look forward to the Q3 earnings season onslaught. It all begins tomorrow when Delta Air Lines (DAL) and PepsiCo (PEP) post profit numbers for the July–September period.
Many of the big banks then report to the Street on Tuesday morning next week. On the tech-adjacent front, Netflix (NFLX) numbers come on the afternoon of October 21, followed by Tesla’s (TSLA) quarterly results on October 22. Alphabet (GOOGL), Meta Platforms (META), Microsoft (MSFT), Apple (AAPL), and Amazon (AMZN) earnings don’t hit until the final week of the month.
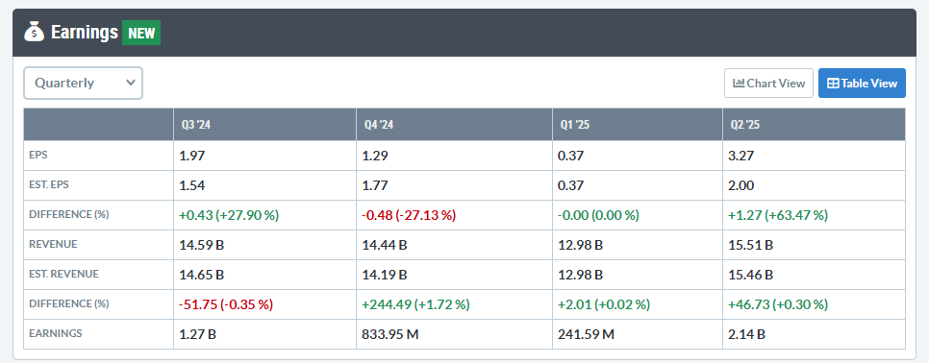
You can view all upcoming earnings releases on StockCharts’ Earnings Calendar. It’s a handy tool to spot volatility catalysts for individual stocks and industries. I particularly like sorting the earnings reports by index (such as the S&P 100 to look exclusively at the largest caps).
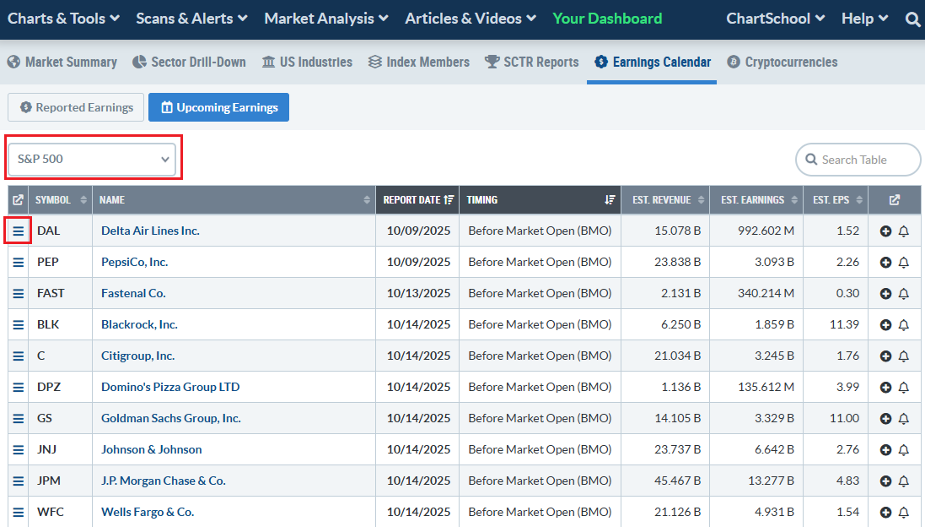
What’s more, each reporting period has a sector cadence (Financials followed by Industrials, followed by Info Tech, followed by Consumer sectors). On the top-left dropdown, you can home in on any of the 11 sectors. If you perform forensic analysis on price action, the “Reported Earnings” tab, located just above the dropdown, is practical.
Let’s begin with a 10,000-foot view of DAL and PEP, the two show-me earnings names that get the Q3 reporting stretch started.
From the Earnings Calendar page, just click on the icon with three horizontal lines on the far left. From the menu that appears, go to GalleryView. In my opinion, there’s no better way to get a simple and complete snapshot of a stock’s trend than GalleryView charts.
What Do the Charts Say?
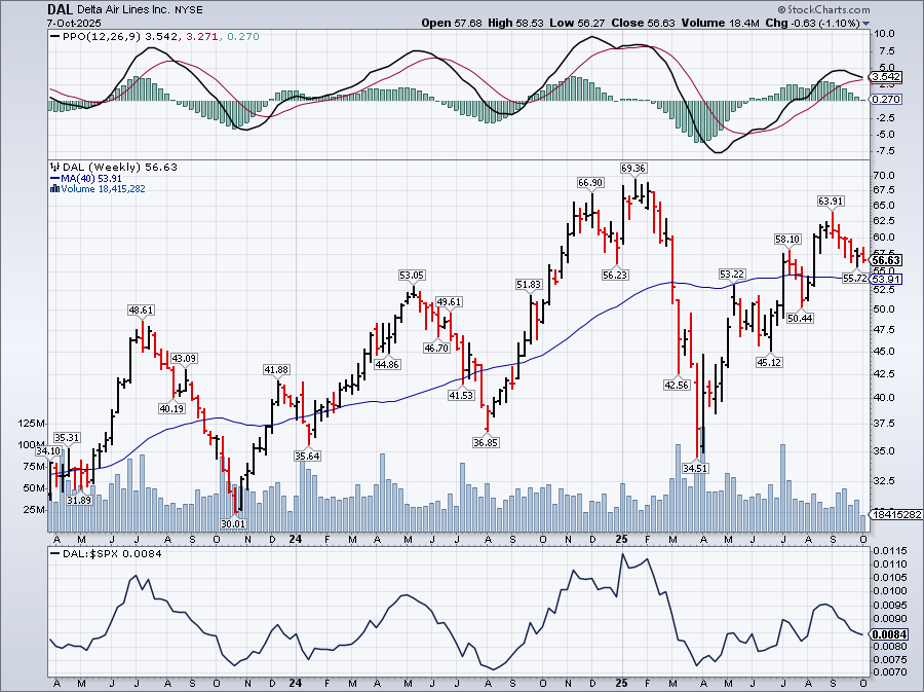
DAL has lagged since the end of the summer travel season. Shares have given back more than 10% from their recent early-September peak, though volume has not been all that high.
On the Weekly View chart below, we see that the long-term 40-week moving average (equivalent to the 200-day moving average) is merely flat in its slope, suggesting an ongoing battle between the bulls and bears. At the Weekly View chart’s base, we see a relative chart (DAL vs. SPX) that highlights how high-beta DAL is. So, fasten your seatbelt for price action on Thursday.
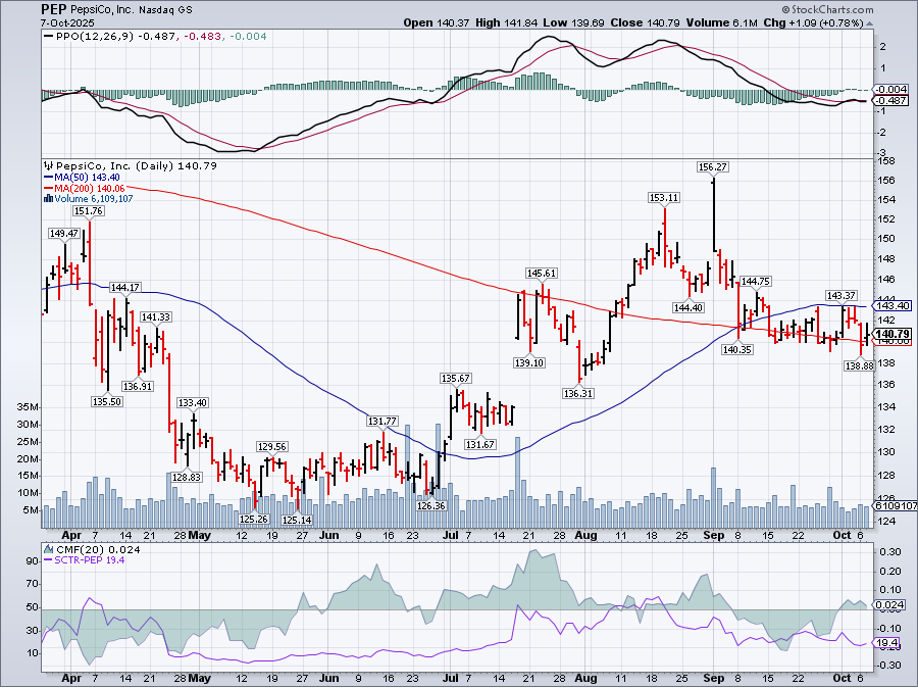
As for PEP, it’s in a precarious position heading into its Q3 numbers. Shares have been straddling the falling 200-day moving average and have found resistance at the flat 50-day moving average. Scrolling down on the page, the old-school Point & Figure View underscores that the bears are on the field (Os are in place since shares peaked at $155).
The far-left icon at the bottom of the GalleryView page can also whisk you away to a treasure trove of fundamental data (you don’t have to be a chartist to take advantage of it). The Symbol Summary page houses key price data and fundamental figures, including valuation, income statement, balance sheet, and cash flow metrics. For earnings specifically, you can view recent sales and profit numbers, including where they verified versus consensus estimates.
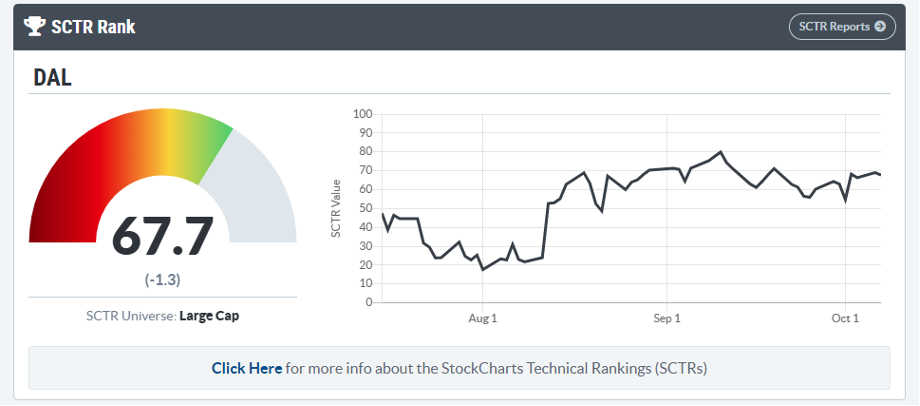
Finally, at the bottom of the Symbol Summary page, the StockCharts Technical Rankings (SCTRs) offer a glimpse into the stock’s relative strength using StockCharts’ proprietary calculation. For DAL, it’s a lofty 67.7, while PEP is a flat 19.4.
All Eyes on Big Bank Earnings
DAL and PEP yield clues about the consumer, but the market’s larger focus will be on next Tuesday morning when the likes of J.P. Morgan Chase (JPM), Goldman Sachs (GS), Citigroup (C), Wells Fargo (WFC), and BlackRock (BLK) issue Q3 earnings. The Financials sector writ large, as measured by the Financial Select Sector SPDR ETF (XLF), has stalled.
Traders have been biding their time waiting for the most important banks to deliver the goods — we'll find out next week. Notice in the chart below that XLF is trading within a tight range between $53 and $54.50. While that is generally above the previous peaks this year ($52.63 in March and $53.49 in July), the 50-dma is flattening out. What’s more, the RSI momentum oscillator at the top of the graph has given back ground, now barely above 50. But could this consolidation be good news?
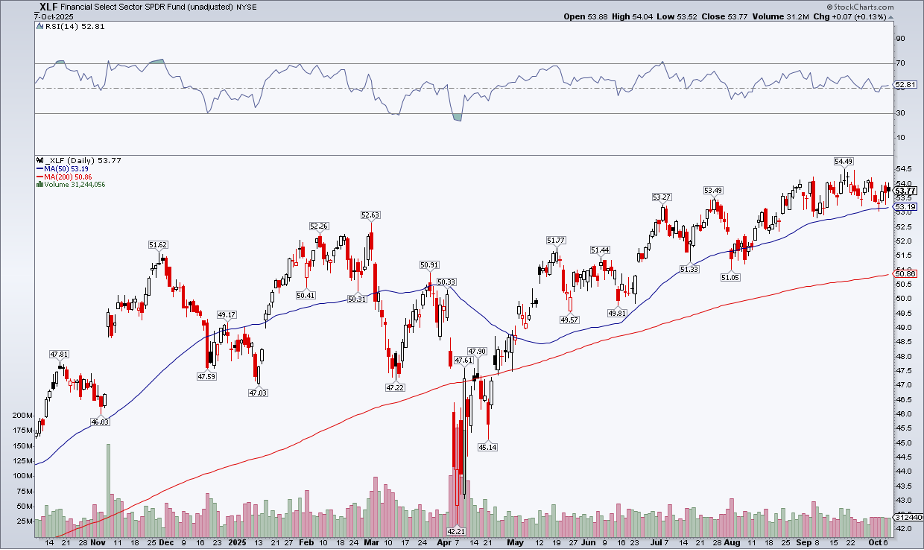
Unlike some previous earnings cycles, there hasn’t been a steep rally heading into JPM et al.’s third-quarter updates. A break below the 50-dma could pose problems, while a breakout above $53.50 would obviously be bullish heading into year-end.
Zooming out, XLF looks fine on a long-term view. I was surprised, however, to see that the SPDR S&P Bank ETF (KBE) has underperformed the S&P 500 ETF (SPY) so significantly for so long. KBE is effectively an equal-weight ETF, so it’s much more impacted by domestic small-cap and mid-cap bank stocks. KBE:SPY bottomed in Q2 2023, around the time of the regional banking crisis, but the subsequent relative bounce back has been unimpressive. In fact, KBE:SPY has rolled over since late November 2024 (when a chunk of the cyclical and pro-growth trade petered out).
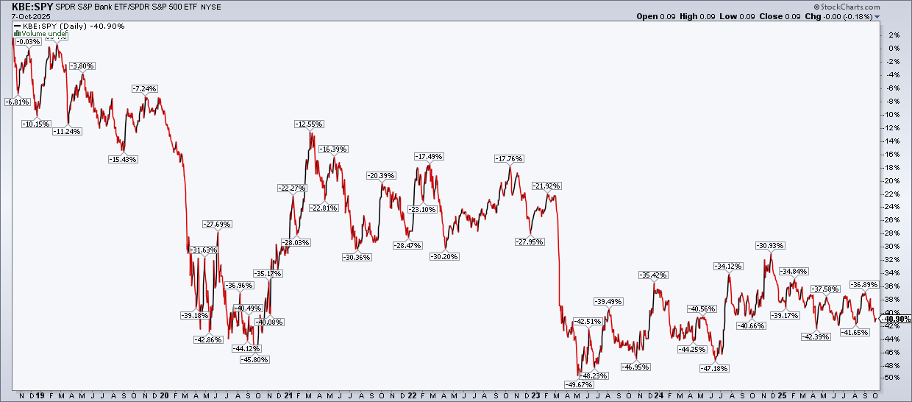
I’m not watching a specific level on KBE. Rather, I’d like to see its outperformance resume—that would bode well for the broader economy. With Financials bobbing around the highs and a chunk of the Consumer Discretionary sector now trending down, we’ll take all the non-tech bullish trends we can get.
The Bottom Line
Consumer Discretionary and Consumer Staples enter the Q3 earnings season on their back foot. Financials are up since September 8, but banks are down 3%. Basically, anything not tech, AI, Health Care, or gold has cooled recently. DAL and PEP may offer the first fireworks, and executive commentary will be closely listened to by Wall Street. Next week, bank earnings could also spark volatility. Traders can stay ahead of risk using StockCharts’ earnings data and price charts.
Disclaimer: This blog is for educational purposes only and should not be construed as financial advice. The ideas and strategies should never be used without first assessing your own personal and financial situation, or without consulting a financial professional.


