Is QQQ Losing Steam? These Chart Clues Say Maybe

Key Takeaways
- Despite Tuesday's dip, QQQ remains above its key moving averages on the weekly chart.
- The RSI is edging into overbought territory, and the MACD is at an elevated level.
- Look for at least two indicators to confirm the overall trend direction before taking action.
We’re now on day 7 of the U.S. government shutdown, and early Tuesday trading looked as if the market would keep chugging along. By the end of the day, however, all the major indexes had lost ground, and the S&P 500 ($SPX) broke its seven-day winning streak.
The hardest-hit sectors were Consumer Discretionary and Technology. AI stocks, which have been soaring lately, took a step back. Could this be the start of a pullback in tech stocks?
Let’s dive into that question.
Focusing on the Nasdaq 100 ($NDX)
The Nasdaq 100 Index ($NDX) slipped 0.55% on Tuesday. To get a better sense of the price action in the index, I turned to a trading strategy from Leslie Masonson’s book The QQQ & TQQQ ETF Profit Machine: A Roadmap for Trading and Investing in Cutting-Edge AI-Focused Tech Titans.
The weekly chart of QQQ below includes the six indicators and overlays used in Masonson’s strategy. Let’s review what the chart is indicating, one piece at a time.
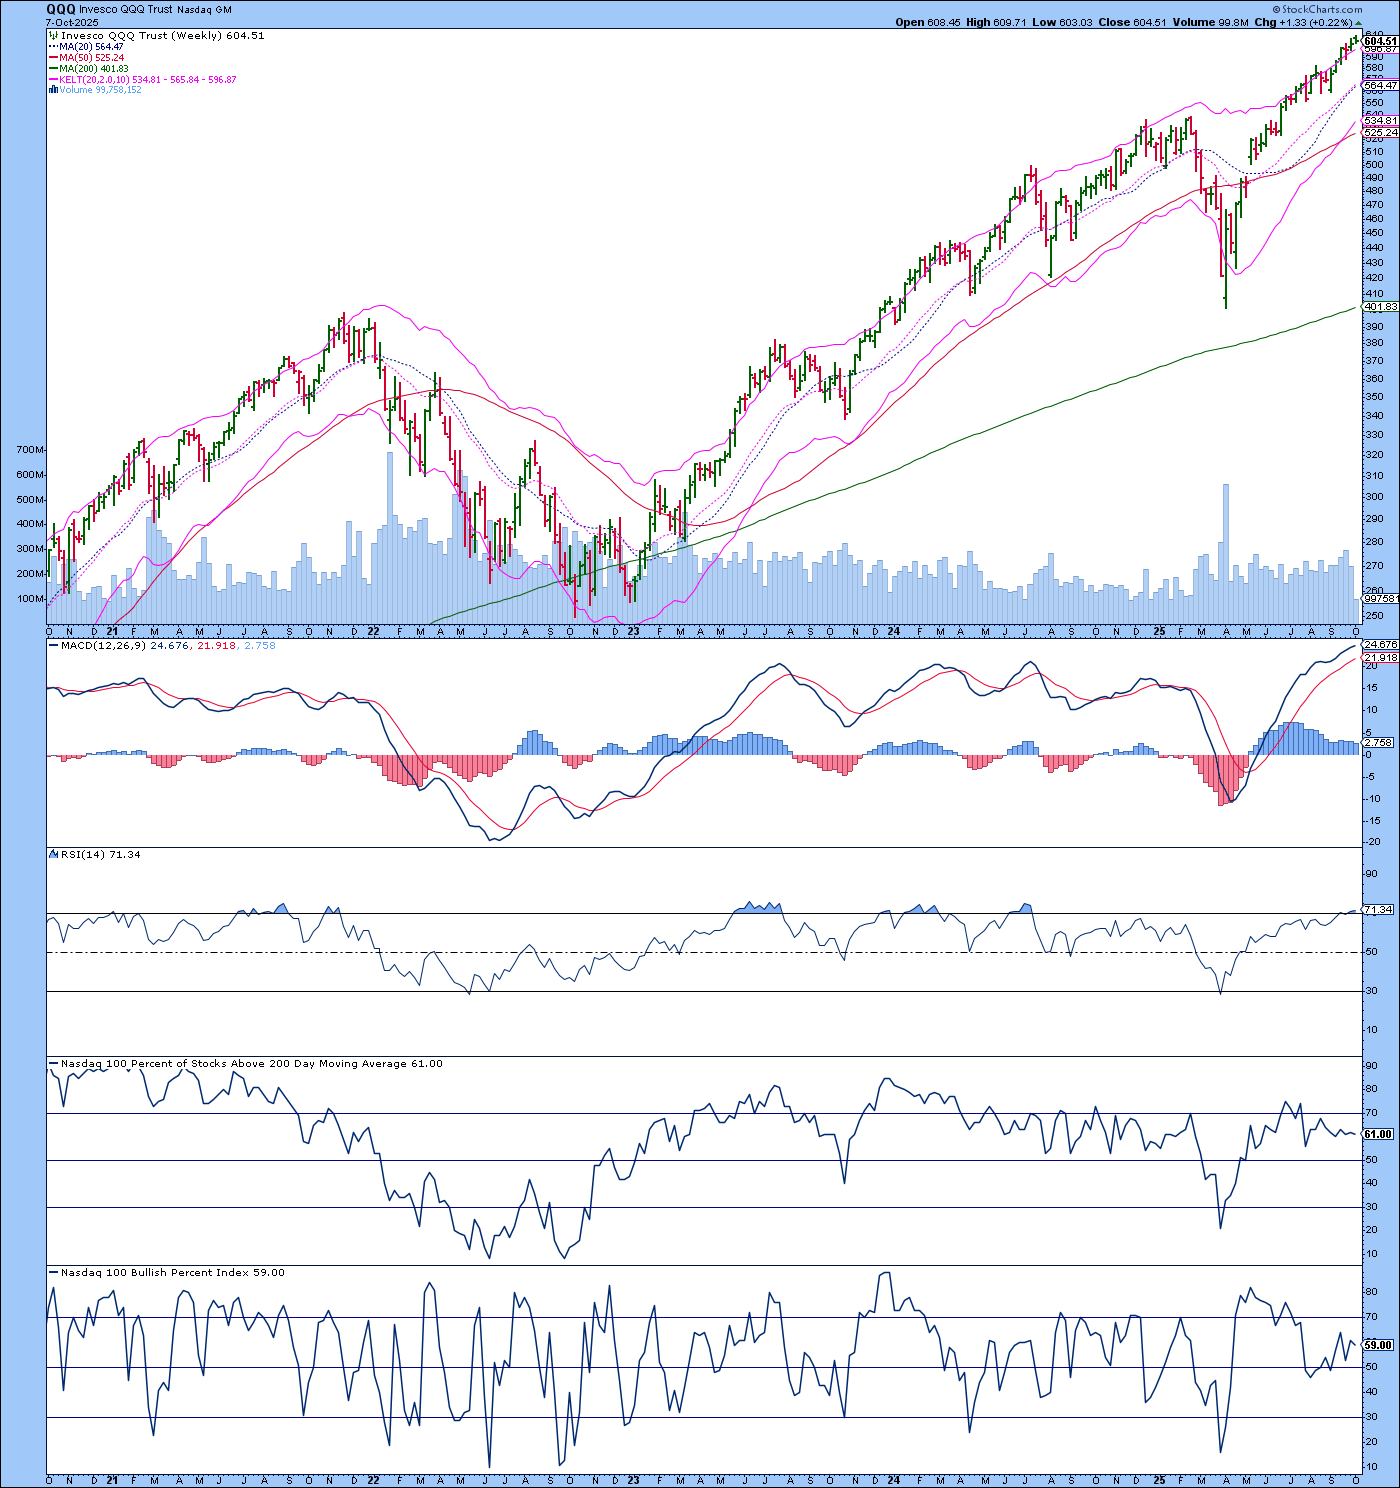
Simple Moving Averages (SMAs). Three simple moving averages—the 20-, 50-, and 200-week—are overlaid on the chart. Right now, QQQ is trading above all three moving averages, which you want to see in a strong uptrend. The moving averages are also in the correct order: the 20-week is above the 50-week, which is above the 200-week.
If the moving averages confirm a bullish trend, at least two of the following indicators should confirm the bullish move. If the moving averages are trending down, then two of the following indicators should confirm the bearish move.
Keltner Channels. QQQ crossed above its upper Keltner Channel, which suggests a strong bullish trend. If QQQ drops back below the upper channel, it could signal a short-term pullback. Keep an eye on the middle line (20-week exponential moving average). A bounce off that line could mean the uptrend is resuming. However, if the ETF falls through the middle line, especially toward the lower channel, it might be an indication of the early stages of a downtrend.
Moving Average Convergence/Divergence Oscillator (MACD). The MACD and Signal lines are trending higher with no signs of a bearish crossover. Given the MACD is, relatively speaking, at an extreme level, there’s a greater chance of a bearish crossover. Keep an eye on it. The MACD may not be flashing a sell signal yet, but the potential for a shift is there.
Relative Strength Index (RSI). The RSI has just nudged into overbought territory, although it’s still in the early stages. Given Tuesday’s pullback, investors should exercise caution before opening new long positions.
% of Nasdaq 100 stocks trading above their 200-day SMA. I tweaked the original strategy slightly to take a longer-term view. Since 61% of NDX stocks are trading above their 200-day SMA, conditions still point to bullishness. However, note that the value hasn’t really moved much in a few weeks.
Nasdaq 100 Bullish Percent Index (BPI). The BPI is at 59, which leans bullish, though it’s been inching lower. Think of it as a “cautiously optimistic” reading.
A Shorter-Term Perspective
When you switch to a one-year daily chart, you’ll notice slightly bearish conditions developing.
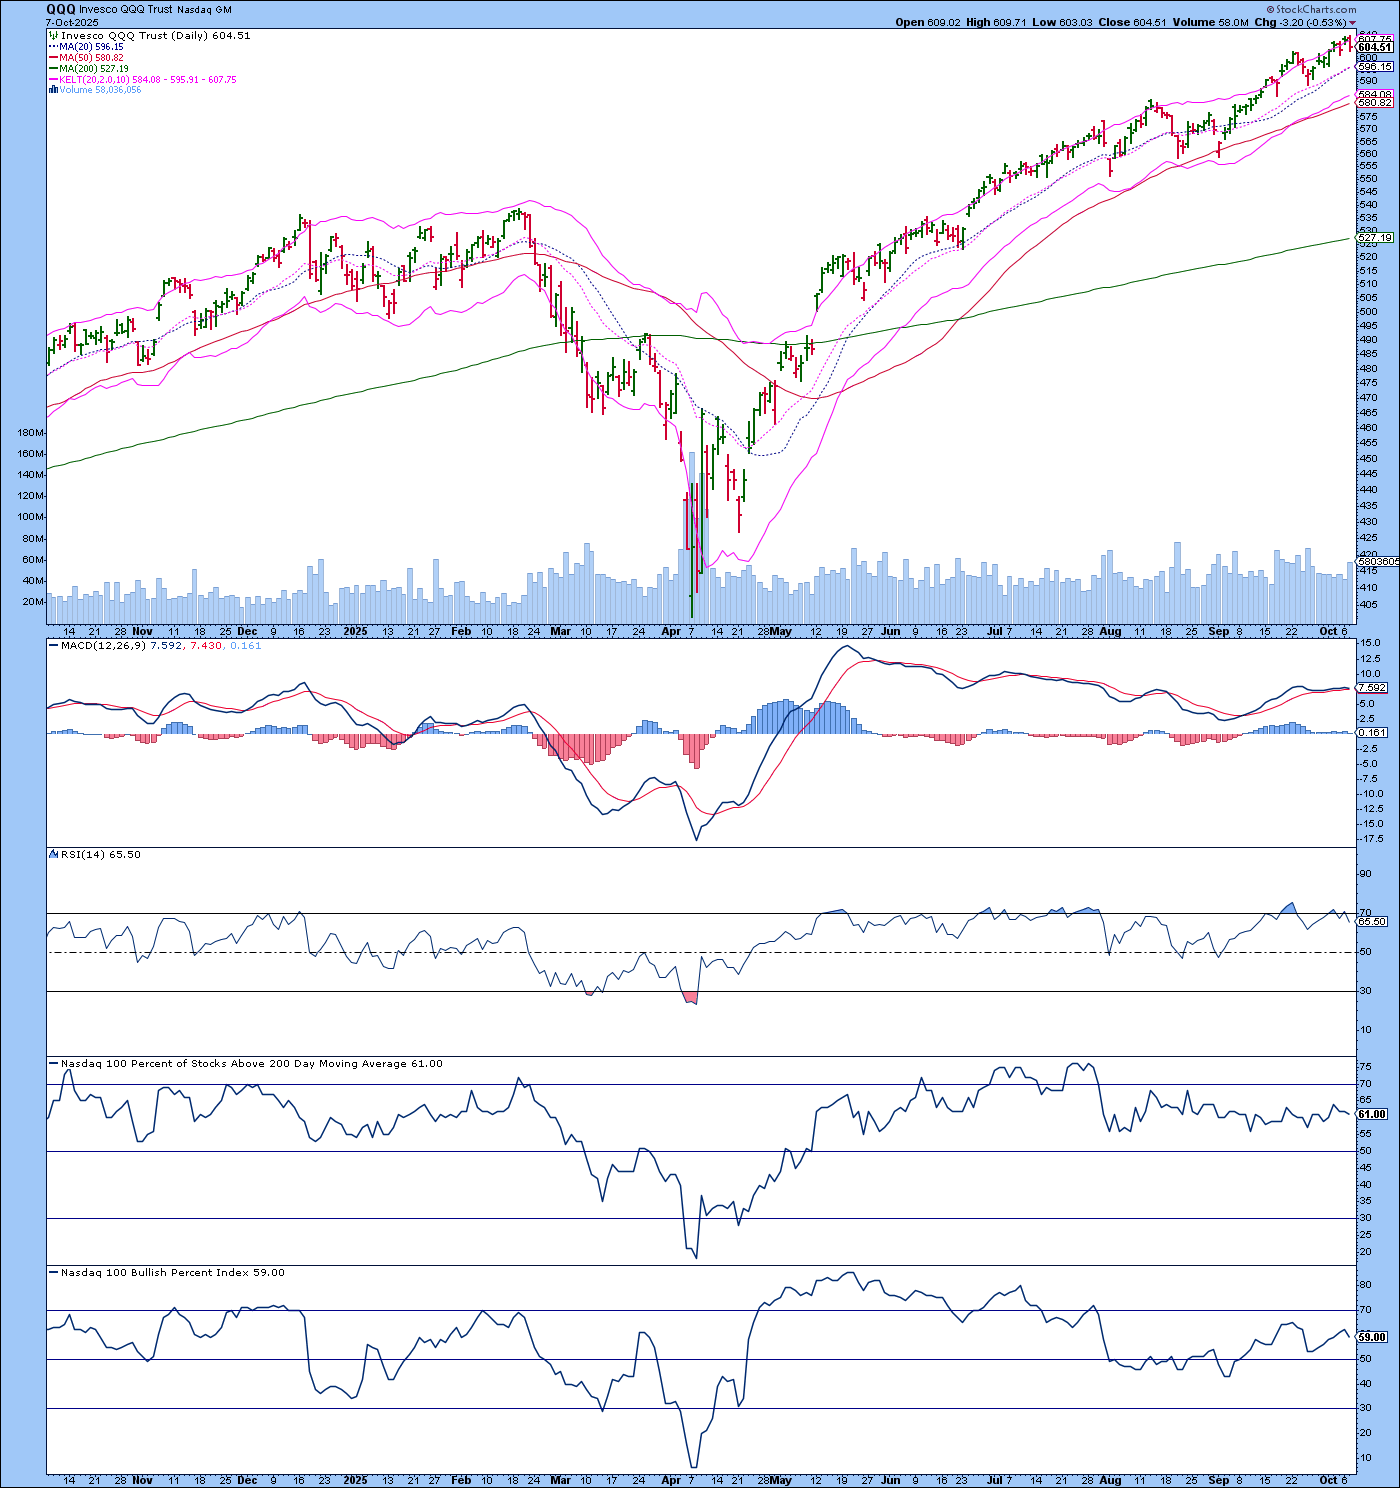
QQQ is still above its 20-day SMA and within the Keltner Channel, which are both bullish signs. However, the MACD and RSI are showing some loss of momentum. This indicates the uptrend may be tiring, at least for now.
The Bottom Line
Despite Tuesday’s pullback, the overall trend is still bullish. On the weekly chart. QQQ is still trading above its Keltner Channel. However, with QQQ as overextended as it is, keep a close eye on the price action within the Keltner Channels. If a sell signal is triggered, make sure at least one of the other indicators confirms the signal before you take any action.
Pullbacks often provide buy-the-dip opportunities. However, if it’s a reversal from a bullish to a bearish trend, be prepared to reevaluate your portfolio holdings.
Disclaimer: This blog is for educational purposes only and should not be construed as financial advice. The ideas and strategies should never be used without first assessing your own personal and financial situation, or without consulting a financial professional.


