Jensen Has the Ball: Will NVIDIA GTC AI Be a Market Buzzer-Beater?

Key Takeaways
- NVDA sits near key support ahead of its highly anticipated GTC AI conference.
- Tech leads March performance, but the S&P 500’s next big move may hinge on Jensen Huang’s keynote next Monday.
- Amid the war in Iran and volatile oil prices, traders should not overlook trends developing in tech.
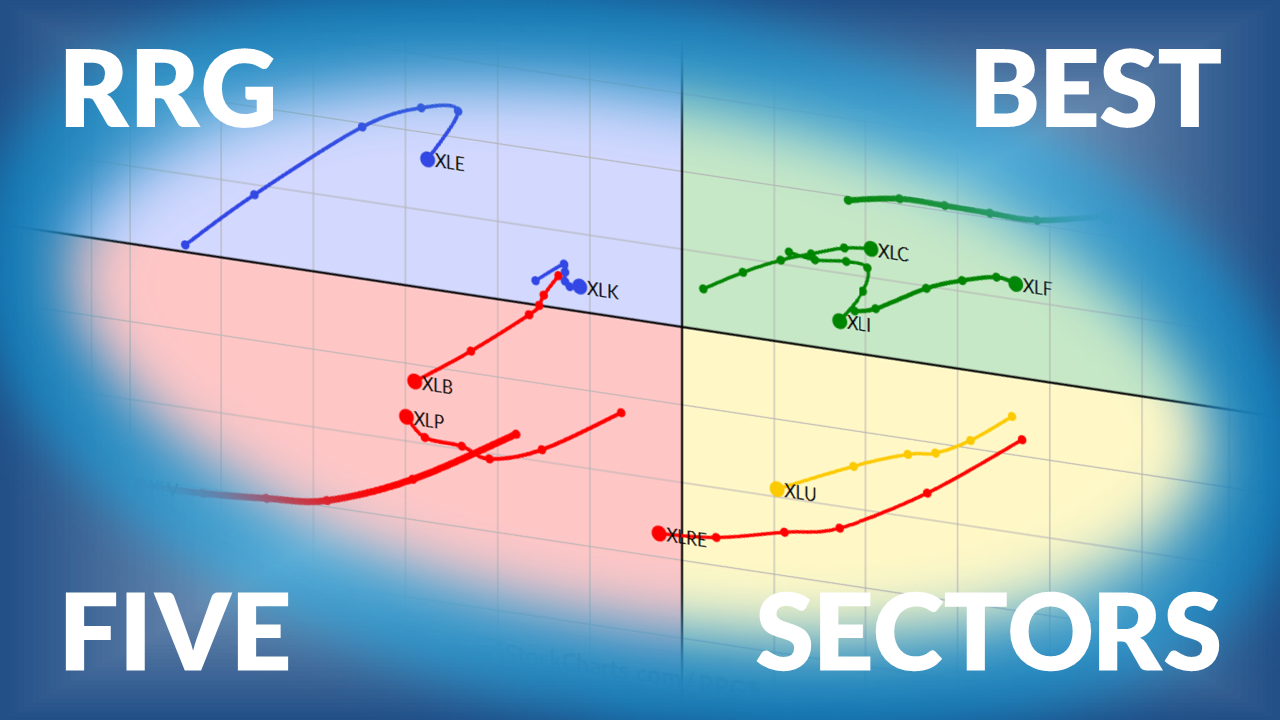
Pop quiz: What’s the top-performing S&P 500 sector ETF so far in March?
You might say Energy (XLE), given the monster rallies in WTI and Brent crude oil this month, along with strong global natural gas price trends. But you’d be wrong. Information Technology (XLK) is the lone positive group about one-third into the turbulent final month of the first quarter.
In fact, just three sector funds are beating the S&P 500 ETF (SPY) through early Wednesday, the 11th—XLK, Communication Services (XLC), and XLE.

Eyes will soon shift squarely to the lead dog. NVIDIA (NVDA) hosts its annual GTC AI Conference & Expo March 16–19 in San Jose, CA. Developers, researchers, and business leaders convene, and the event’s highlight will be Monday afternoon, when NVIDIA CEO Jensen Huang takes the stage. His keynote may touch on AI factories, digital twins, the benefits of sovereign AI, and the broader advantages of AI’s five-layer cake.
Walking a Technical Tightrope
Tech enthusiasts will have at it. Likewise, traders should listen in and (more importantly) watch price action.
This year’s gathering comes at a critical time for the shares of the world’s most valuable company. Notice in the chart below how NVDA is barely hanging on to its long-term 200-day moving average—it hasn’t been below it in 10 months. Should the stock react negatively to GTC, a bearish death cross can’t be ruled out just as the first quarter comes to a close.
As it stands, the bulls have defended NVDA on numerous dips to near $170. The $164 to $175 zone may be support, but there could now be an uptrend support line that comes into play near $174—a breakdown below that would not bode well for the AI trade.
What’s more, recall the post-earnings pop to $203 back on February 25. It appeared a breakout was underway, with XLK, the Nasdaq 100 ETF (QQQ), and SPY poised to reach new highs, but there was no such luck. NVDA went on to crater 15% over just a few sessions, dropping to $173.

A High-Stakes Moment for the AI Trade
NVIDIA GTC AI is a second chance for the bulls to demonstrate their might. It’s not a stretch to say that as goes NVDA, so goes the broader stock market. The S&P 500 remains vulnerable to a bearish rounded-top pattern, despite several strong intraday showings amid the Iran war. Just 3% off its record high, the S&P 500 is also about the same amount above the 200dma.
Thus, poor price action next week during and after the NVIDIA event could be the catalyst to break this largely trendless stretch that dates back to last October.
Volatility Signals to Watch
We can get more color on NVDA’s recent track record on the StockCharts Symbol Summary page. The ATR (14) metric caught my eye. The stock’s average true range is 3.4% over the past 14 sessions is $6.30. On a look-ahead basis, NVDA’s implied volatility is 40%, with the next earnings event not until late May (the options market prices in about a 2.5% daily price change).
Be sure to review risk-management indicators like these before Jensen grabs the mic Monday afternoon.
New Contenders in Tech Leadership
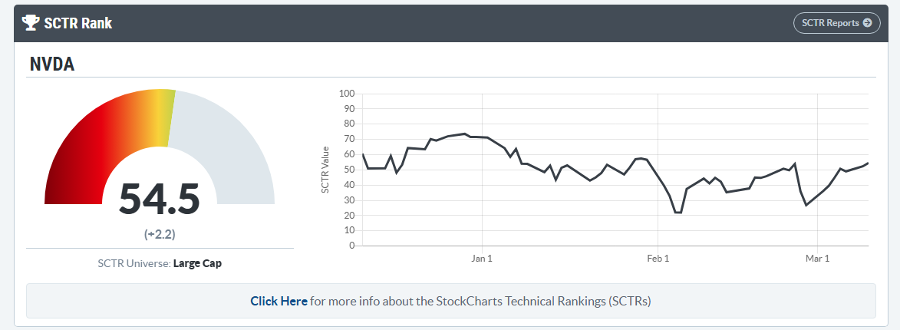
Down 1% year to date, NVDA’s StockCharts Technical Rank (SCTR) is lukewarm at 54.5. This relative strength gauge confirms that the former leader in this bull market has ceded alpha to other tech players, such as SanDisk (SNDK), Micron (MU), and Western Digital (WDC).
Interestingly, on the SCTR Reports page, Information Technology still dominates, with just a few Materials and Industrials names at the top of the stack. Biotech quietly appears, too. Indeed, the SPDR S&P Biotech ETF (XBI) is within earshot of a 52-week high, both on an absolute basis and relative to the S&P 500.

The Bears Eye an Opportunity
Getting back to NVDA, the bears may have the possession arrow as March Madness gets going. According to the OptionsPlay Score in the OptionsPlay Strategy Center, NVDA appears on the Bearish Trend Following scan. Long puts may be favored going out a month, given the healthy 97 tally.
Waiting for the Break
My take? Wait for a close below $170 before getting too bearish on the $4.4 trillion market cap company. The most dire scenario could be a breakdown below the aforementioned support line, triggering a major head-and-shoulders top. The measured-move price target would be $130–$135, based on the $212 head and the low-$170s neckline (annotated in blue in the above NVDA chart).
Big picture, the S&P 500 would simply not be able to overcome that kind of bearish situation, and perhaps a midterm-year correction would be in the works.

Bottom Line
XLK is the No. 1 sector seed so far in March, but I’m not convinced a rally to new SPX highs is a layup for the bulls. While we are only in Q1, the clock is ticking down until NVIDIA GTC AI, and Jensen has the ball. His keynote on Monday could be a buzzer-beater or a brick, laying the foundation for an S&P 500 breakout or breakdown. I’m watching coiling NVDA price action, along with key support in the low to mid-$170s.
Disclaimer: This blog is for educational purposes only and should not be construed as financial advice. The ideas and strategies should never be used without first assessing your own personal and financial situation, or without consulting a financial professional.