Loved to Unloved: Why the Financials Sector is the S&P 500 Bellwether Right Now
Key Takeaways
- Big and small banks, private credit stocks, and credit card names have stabilized, offering hope to S&P 500 bulls.
- Near-term Financials’ price action tells a different story than dismal macroeconomic narratives
- Earnings season is not far off, and upcoming technical trends will be critical to evaluate.
The bears have sunk their teeth into March, no doubt about it. Even with occasional stock market snapbacks, the S&P 500 remains down about 3% on the month, with even worse performance from high-beta plays like U.S. small caps and emerging markets. But is there a glimmer of hope peeking through the cracks of this year’s worst sector?
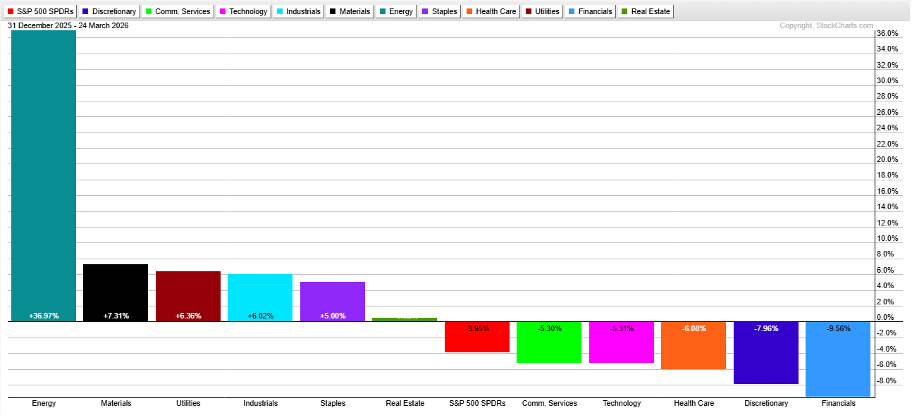
Financials (XLF, for those playing at home) has returned -10% so far in 2026, dividends included. It’s among five S&P 500 sector ETFs that are negative YTD, with five full trading days left in the year as of this writing.
The narratives are well-known at this point. Big banks have been crushed amid fears of a growth slowdown, private asset management stocks have been hammered amid ongoing private credit turmoil, and even credit card service names have been creamed amid perceived AI infiltration and regulatory changes stemming from White House policy.
But does XLF’s chart tell a different story? After all, price leads narrative. We can make the case.
Price Action Suggests a Potential Shift
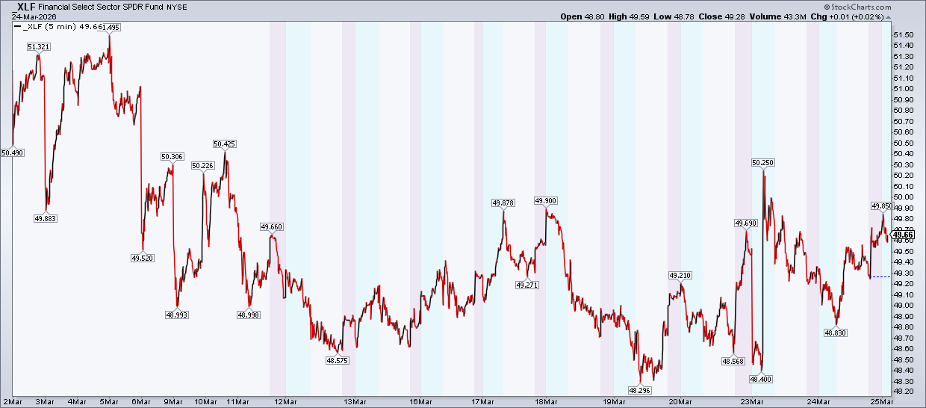
For starters, while the S&P 500 ETF (SPY) has put in a series of lower highs and lower lows, XLF’s nadir (so far) was hit last Thursday. Furthermore, the Financial Select Sector Fund rose to a 13-calendar-day high at this week’s open.
With a fresh set of de-escalatory Iran war comments from President Trump lifting SPX futures last Tuesday evening, XLF might even print a multi-week zenith very soon.
Relative Strength Finally Improves
Next, let’s dissect relative price action. XLF:SPY has been a ski slope of broken dreams. Recall that throughout 2025, many, many pundits (including yours truly) bought into the notion of deregulation, increased capital markets activity, and strong Main Street economics boosting profits for banks big and small.
Well, price is the ultimate arbiter, and XLF has literally gone straight down and to the right compared to SPY going since last March. Is the trend ready to inflect?
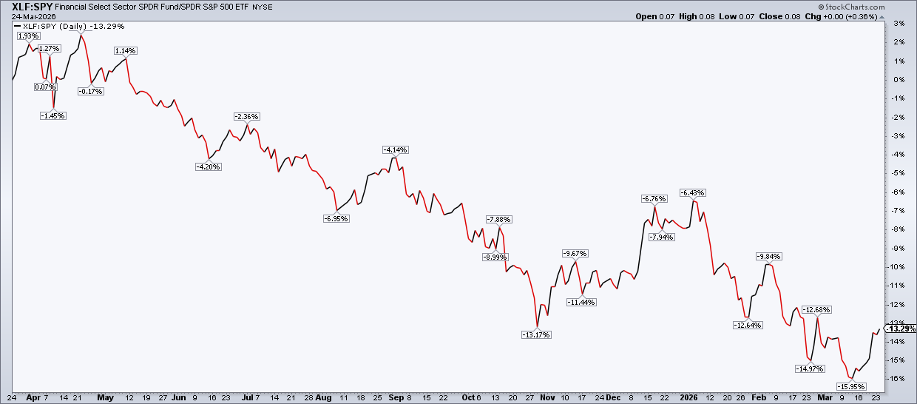
That I can’t tell you. What we can glean from the XLF:SPY relative performance chart is a notable (and perhaps surprising) rebound over the past two weeks. Intuition says that Financials, being a generally risk-on and cyclical play these days, would be among March’s laggards. But the reality is not so much, actually.
At the moment, banks are stabilizing (JPM, BAC, WFC, C, BK, GS, and MS are collectively flat month-to-date). You could win bets asserting that KKR and APO shares are having a great final month of the first quarter.
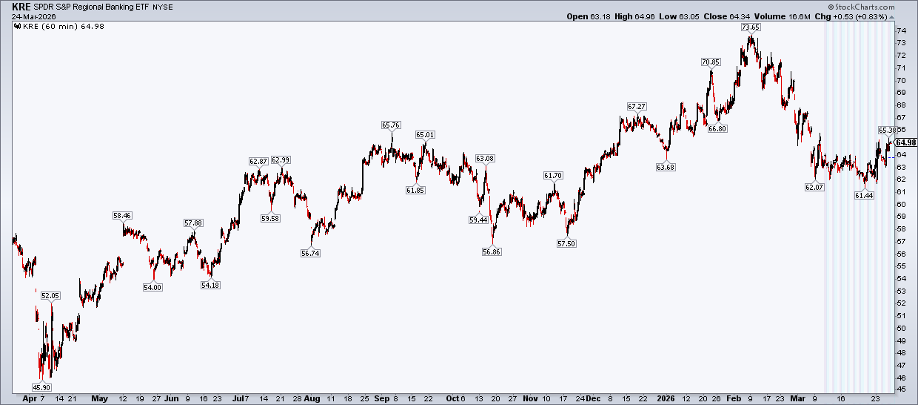
Regional Banks Show Signs of Life
Regional banks (KRE) are another group off the mat. Despite growing recession fears, jumpy inflation expectations, and a flattening Treasury yield curve, KRE is 6% off its March and multi-month low. There’s still work to be done, but regional banks are a bellwether industry.
The ETF continues battling its long-term 200-day moving average while defending critical support near $58. For now, the very recent absolute and relative strength are encouraging heading into Q2.
Earnings Season Could Be the Catalyst
Speaking of the calendar, maybe it’s not surprising to see so many Financials names catch a bid. An infamous Wall Street trend is for banks to rally into quarterly earnings, then get smacked (even after posting robust revenue and net interest margins).
I noticed that it’s a bit of a different schedule this upcoming season: BlackRock (BLK) is first among the major Financials sector companies to post Q1 numbers on Friday, April 10 BMO. Goldman Sachs (GS) is second on Monday morning, April 13. Then come the big banks: JPM, WFC, and C report before the bell the following Tuesday.
You can keep track of all the major earnings dates on our Earnings Calendar.
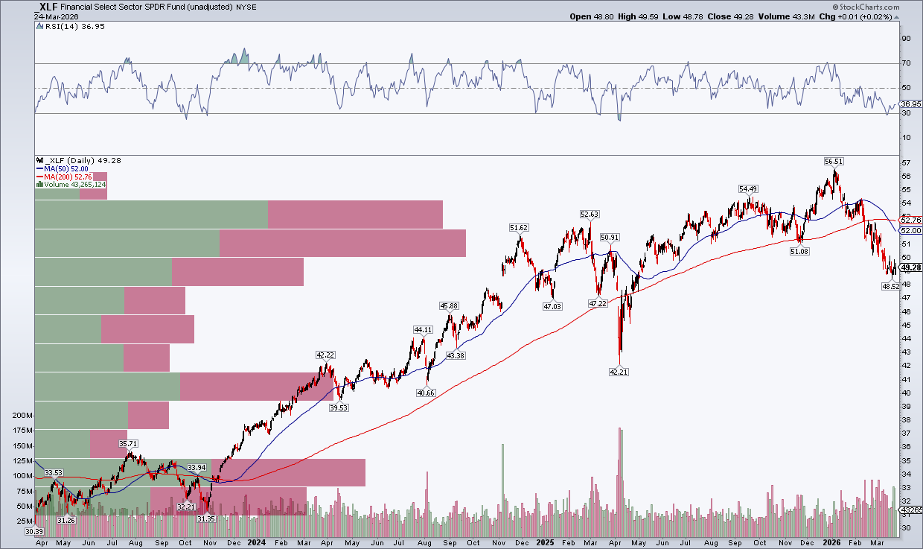
XLF: The Long-Term Trend Remains Challenged
Let’s finish up by zooming out. Notice in the chart below that XLF’s three-year look is not exactly ideal. There was a bearish death cross (50-day moving average falling below the 200-day moving average) last week, while the RSI momentum oscillator at the top has been under 50 since early January.
Now, with the 200-day moving average rolling over, the bears control the primary trend, even with some very near-term green shoots. Also, take a look at the volume-by-price profile on the left side of the chart. There’s a high number of shares traded above today’s level, making rally attempts all the more difficult for the bulls. All that hope put into XLF’s trend last year has become a technical burden.
XLF: Key Levels to Watch
Long-term support is down at $42, a former high from January 2022 and where XLF reached a floor shortly after Liberation Day last April. If it were to test that spot, a 25% XLF decline would likely coincide with a technical bear market in the S&P 500. For now, $45 is resistance.
Bottom Line
XLF is not the most bullish chart out there, but there are short-term reasons for hope based on price action. Big banks’ shares have held their own, while the risky regional bank ETF has been more resilient than many traders may realize.
I’ll be watching relative charts (including extended-hours trading), along with performance leading into, and more importantly after, key Q1 earnings reports that begin hitting the tape in just a couple of weeks.
Disclaimer: This blog is for educational purposes only and should not be construed as financial advice. The ideas and strategies should never be used without first assessing your own personal and financial situation, or without consulting a financial professional.


