Mag 7 Leaders and Laggards; 3 Trend Reversals; Analysis and Key Levels for Apple
Key Takeaways
- Alphabet, Apple, and Tesla outperforming the broader market.
- Amazon, Meta, and Microsoft in downtrends.
- Apple gets oversold bounce, consolidates within uptrend.
Mag 7 stocks powered the market higher from April to October but have sputtered since November, with three breaking down on the price charts. Four of the seven, however, are still in long-term uptrends. Today's report will start with the three laggards and then turn to Apple, which is a leader. Note that we cover Alphabet (GOOGL), NVIDIA (NVDA), and Tesla (TSLA) in a separate report for subscribers.
Alphabet, Apple, Tesla Outperform
The table below shows the performance for the Mag 7 and the Invesco S&P 500 Equal Weight ETF (RSP) over the last six months. Alphabet, Apple, and Tesla are the three leaders because they have the largest gains and are outperforming RSP, which is up 8.80%. NVIDIA also sports a gain, but is underperforming the broad-based RSP. Amazon, Meta Platforms, and Microsoft are the laggards because they are down over the last six months.
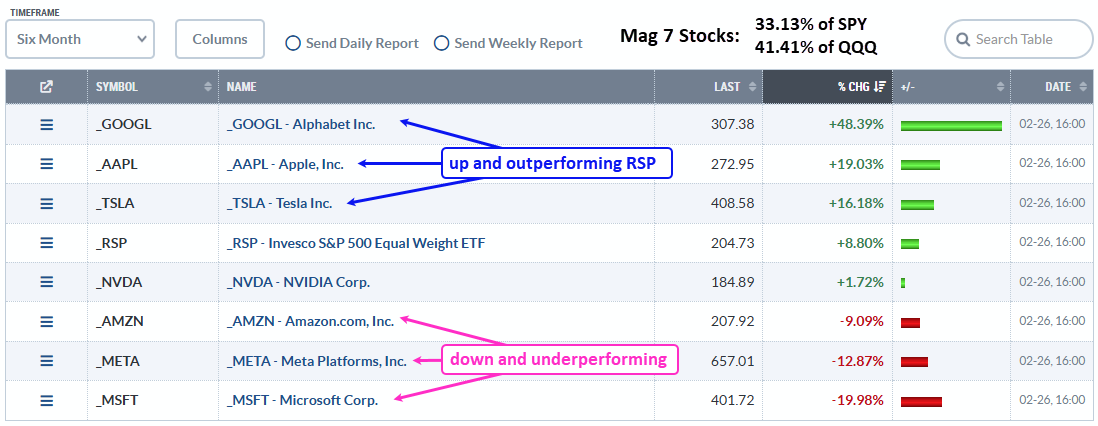
Mag 7 stocks are important when considering performance for the SPDR S&P 500 ETF (SPY) and Invesco QQQ Trust Nasdaq (QQQ). These seven stocks account for 33% of SPY and 41% of QQQ. SPY and QQQ can plod along as long as four of the seven hold up. The trouble starts when these leaders break down.
Breakdown Parade: Meta, Microsoft, Amazon
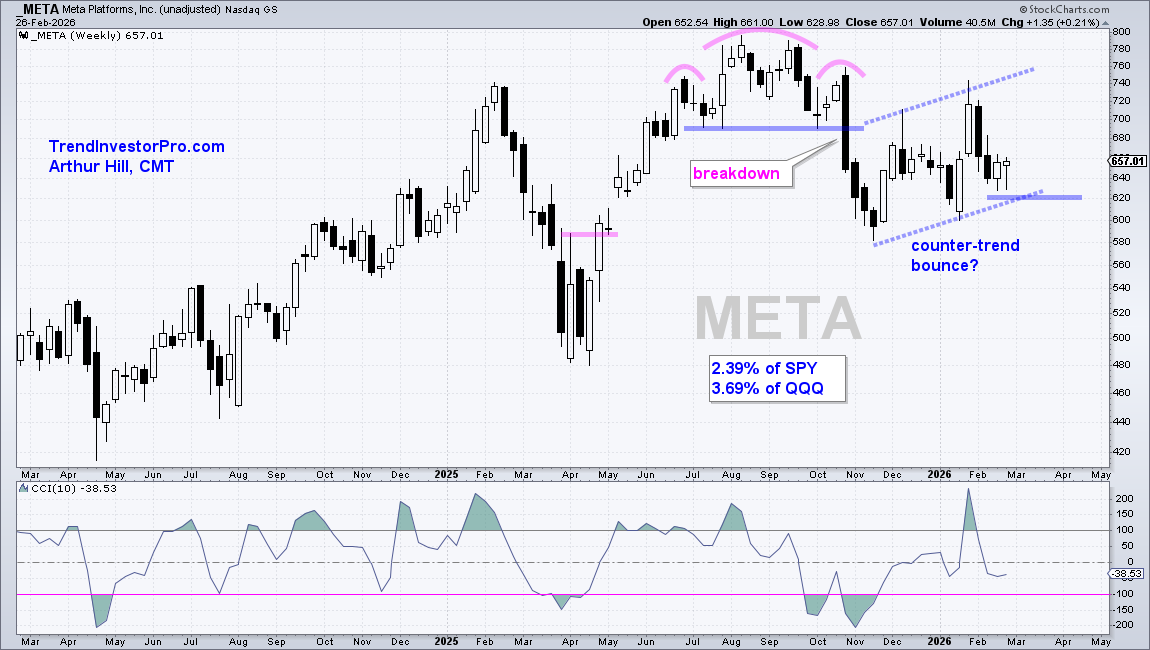
The weekly candlestick chart shows META with a head-and-shoulders top and neckline break in October. META worked its way higher after the breakdown, but this looks like a counter-trend bounce. After a breakdown and sharp decline, a rising channel is typically a bearish continuation pattern, kind of like a rising flag. Currently in the $640 area, the stock is at a make or break level as it trades just above channel support. A break below $620 would signal a continuation lower.
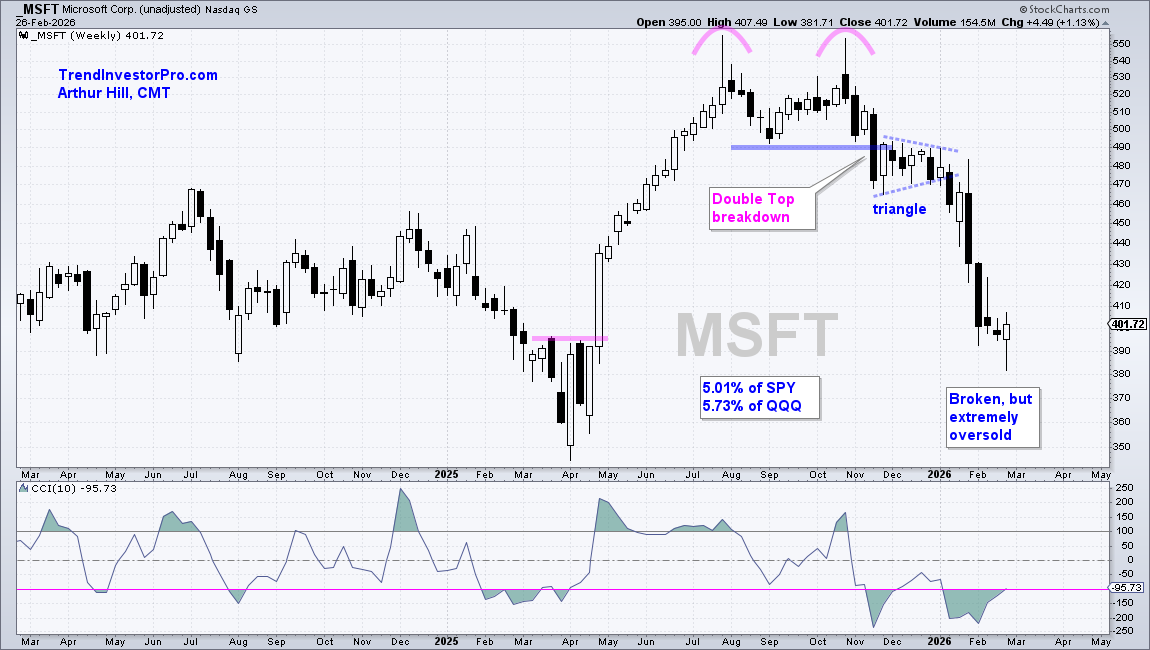
The next chart shows Microsoft with a double top and breakdown in November. After a short stall into early January (triangle), the stock plunged to $400 and became extremely oversold. MSFT is perhaps ripe for an oversold bounce, but in a clear downtrend.
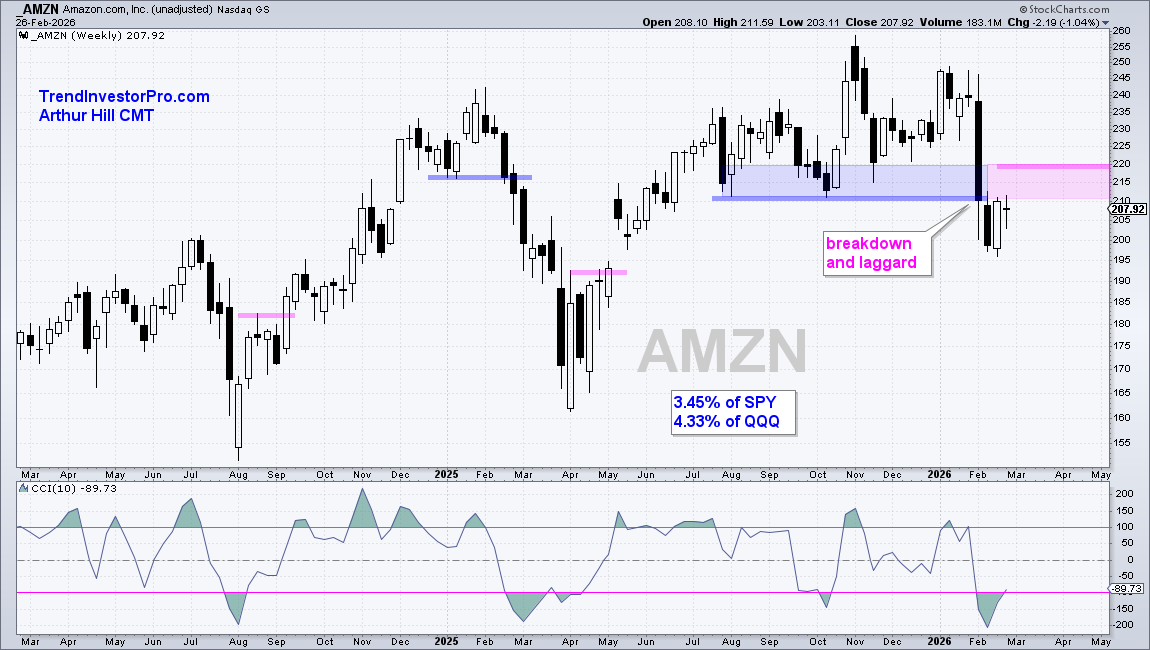
The next chart shows Amazon breaking a well-defined support zone (blue shading) with the February plunge. This break reversed the long-term uptrend. AMZN is currently consolidating below this support break, which turns first resistance (pink shading). A breakout at 220 would negate this trend reversal and call for a re-evaluation.
Recent Reports and Videos on TrendInvestorPro
- Alphabet, Nvidia, and Tesla Analysis and Levels
- Bond ETFs Hold Breakouts as Base Metals Break Out
- Four Stocks from Two Strong Groups (Industrials, Healthcare)
- Stock Market Remains Defensive as SPY Consolidates
Click here to take a trial and gain immediate access.
Apple Gets Oversold Bounce, Consolidates Within Uptrend
The weekly chart below shows Apple (AAPL) in a long-term uptrend with a new high in early December, currently within 5% of this high. A triangle formed as price consolidated in a narrowing range. Typically, a triangle within an uptrend is a bullish continuation pattern, which means an upside breakout at $280 would signal a continuation of the long-term uptrend. Sometimes, however, prices break the other way and the trend reverses, as in March 2025. Thus, watch $255 on the downside.
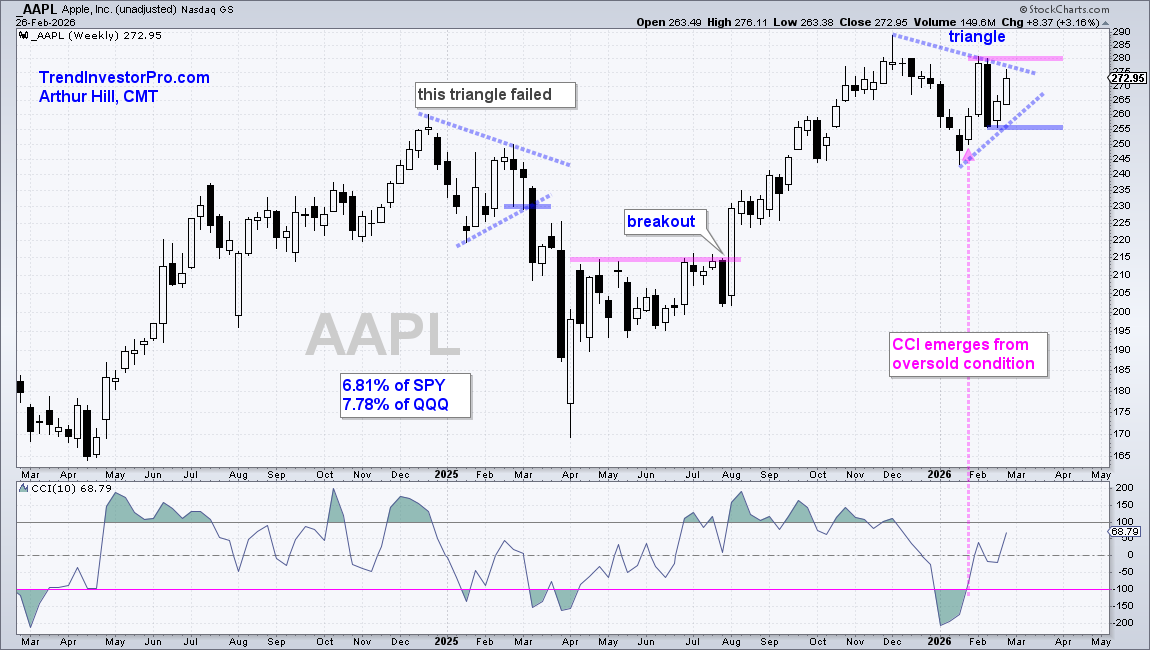
The indicator window shows weekly Commodity Channel Index or CCI(10), which is used to identify oversold conditions within an uptrend. CCI became oversold with a move below -100 in January, then emerged from oversold levels as Apple turned back up. This was a short-term bullish signal. Note that I only look for oversold conditions during bull markets and long-term uptrends.
See TrendInvestorPro for analysis of Alphabet, Nvidia and Tesla - Trends, Patterns at Work and Key Levels.