Mag 7 Malaise: What Big Tech’s Slide Means for the S&P 500
Key Takeaways
- The Magnificent Seven’s sharp Q1 decline has weighed on the SPX, with all but AAPL now in technical bear-market territory.
- Broader segments, including equal-weight US and international equities, show some relative resilience amid the ongoing war in the Middle East.
- Mega-cap tech’s technical deterioration points to potential further downside, though seasonal trends may provide a tailwind for QQQ.
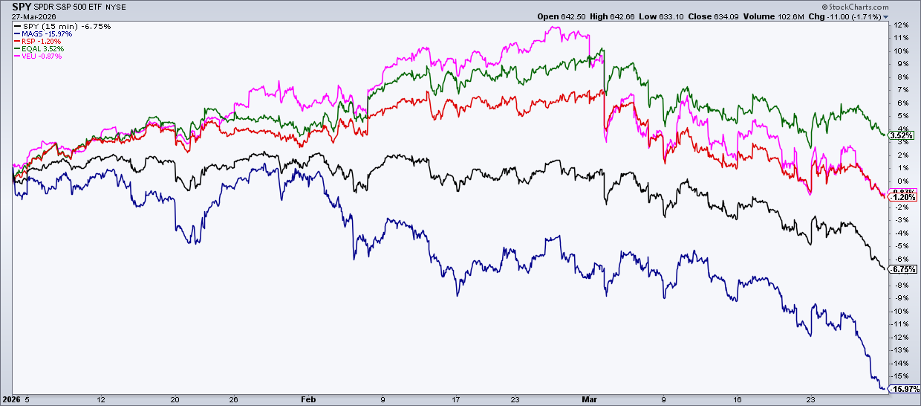
The Magnificent Seven has been humbled in Q1. The group, as measured by the Roundhill Big Tech ETF (MAGS), is down 16.0% year-to-date through March 29, underperforming the SPDR S&P 500 ETF (SPY) by more than nine percentage points. The performance spread is even wider compared to the Invesco S&P 500 Equal Weight ETF (RSP), which is only off 1.2% coming into the first quarter’s penultimate trading day.
Diversified investors are also faring better by owning international equities. The Vanguard FTSE All-World ex-US ETF (VEU) is close to flat so far in 2026, while the very broad Invesco Russell 1000 Equal Weight ETF (EQAL) sports a solid 3.5% total return leading into this holiday-shortened week.
Mag 7 Is No Place for Safety
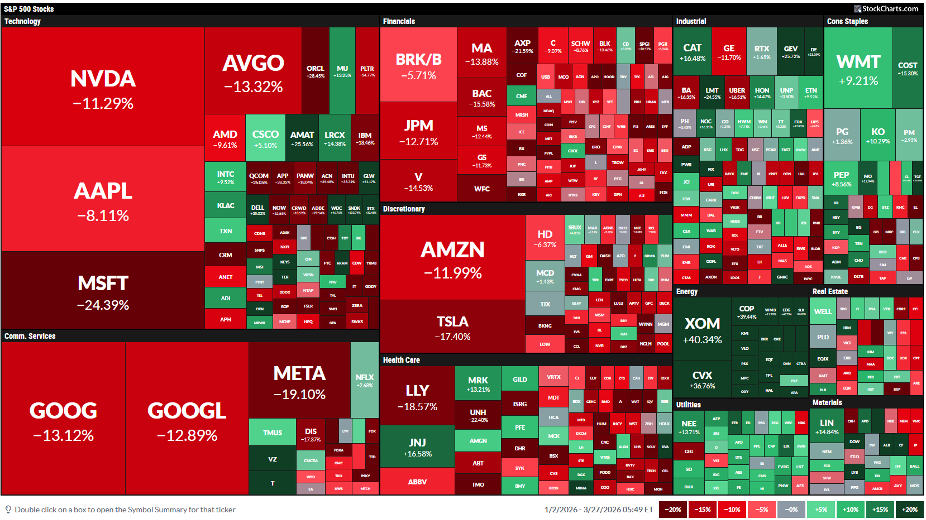
Indeed, last week’s S&P 500 decline (its fifth in a row) was centered on big-cap tech and the Mag 7. Information Technology and Communication Services were by far the weakest sectors, and it came amid ongoing worries about the war and the rising cost of oil.
An emerging narrative during the middle of March was that high-growth sectors were the place to be overweight, as recession concerns could result in an extra “growth premium” applied to stocks like the Mag 7. All of this came as small-cap tech (PSCT) quietly put in a weekly winning streak.
That storyline was quickly erased. Price action often has that effect. While Apple (AAPL) was in the green last week, Microsoft (MSFT) was down 6.6%, Alphabet (GOOGL) shed 8.9%, and Meta Platforms (META) plunged 11.4%. Six of the seven are now down 20% or more from their respective 52-week highs (AAPL is holding up the best, in a 14% drawdown), and the $4 trillion market cap club houses just a lone member: NVIDIA (NVDA).
So, where does the Mag 7 go from here? The math suggests the S&P 500 will have a tough time carving out a bottom until the group of former leaders finds its footing. Let’s dissect the charts.
MAGS Nears a Bear Market
Starting big picture with MAGS, the $3.4 billion ETF endured its worst two-day slide since immediately after Liberation Day to close out last week. Down 19.8% peak to trough, a bearish rounded top pattern (much like the S&P 500’s) unfolded from Q4 2025 through the early part of this year. It sliced through the 38.2% Fibonacci retracement of its April–October 2025 rally, with a bearish death cross moving average pattern occurring today.
Where’s the next stop? I see an interesting confluence of potential support. The 61.8% Fibonacci retracement is just above $50. Also, notice in the chart below that a gap lingers just under $50. If that ultimately gets filled, a 30% drubbing would surely wipe out any lingering bullish Mag 7 sentiment. On the upside, former support becomes new resistance, and the $62–$63 zone could give the longs fits.
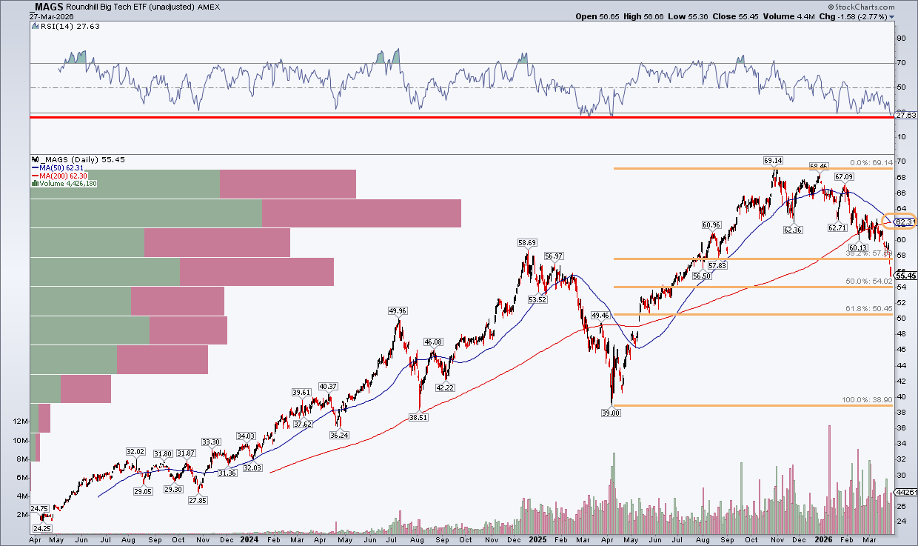
As it stands, MAGS is near the most oversold it has been over the product’s three-year history, and there is now a high amount of volume-by-price above last week’s $55.45 closing level. Remarkably, MAGS is down 5.5% from its December 2024 peak.
Digging Deeper
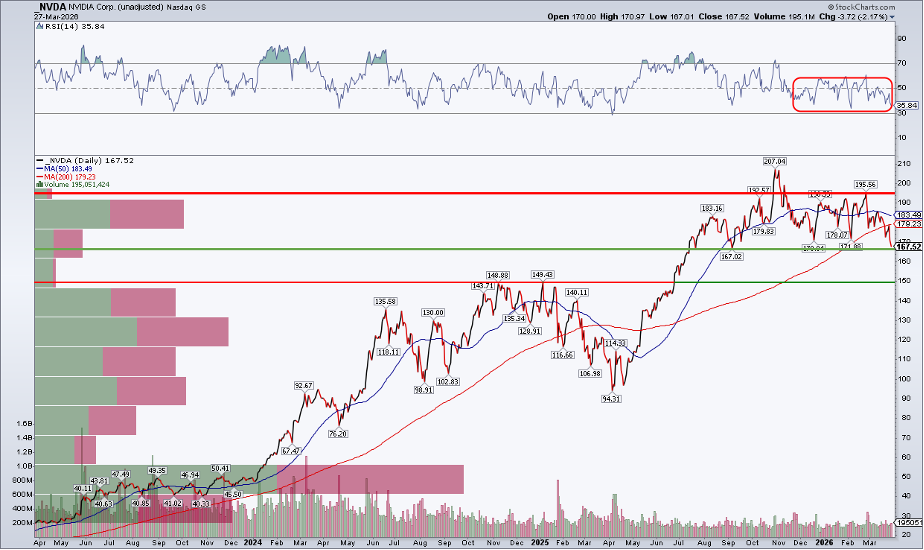
MAGS is not a perfect Mag 7 proxy, but it is the major ETF tracking the group (there is no exact Mag 7 product that perfectly matches the Bloomberg Magnificent Seven Index). So dissecting the individual components is important, and NVDA is the best place to begin.
It was an ugly close last week. Shares settled at the worst level since early September, just pennies from the weakest price going back to July 2025.
Take a look at the RSI momentum oscillator at the top of the chart, which has ranged in a bearish zone between 30 and 60 since November as price consolidated below $200. This is yet another “distribution” pattern, in which there is a lot of churning (and no upside action). The presumption is that large traders are gradually unloading shares. The good news is that a solid congestion zone lies just below the current price, beginning at $149 (the range highs from late 2024 and early 2025).
Interested Buyers?
Fundamental investors may be licking their chops, too. Using out-year EPS estimates, NVDA and META now trade below 16x earnings. This matters technically because a new cohort of investors could drive demand. Portfolio managers focused on value may begin accumulating shares of once-glamorous, now beaten-down, Mag 7 companies. They may wait for quarter-end or the next round of earnings that gets going at the end of April.
I will not assess each of the seven charts, but you can check out GOOGL’s head-and-shoulders pattern here, along with META’s breakdown here.
Flipping the Calendar
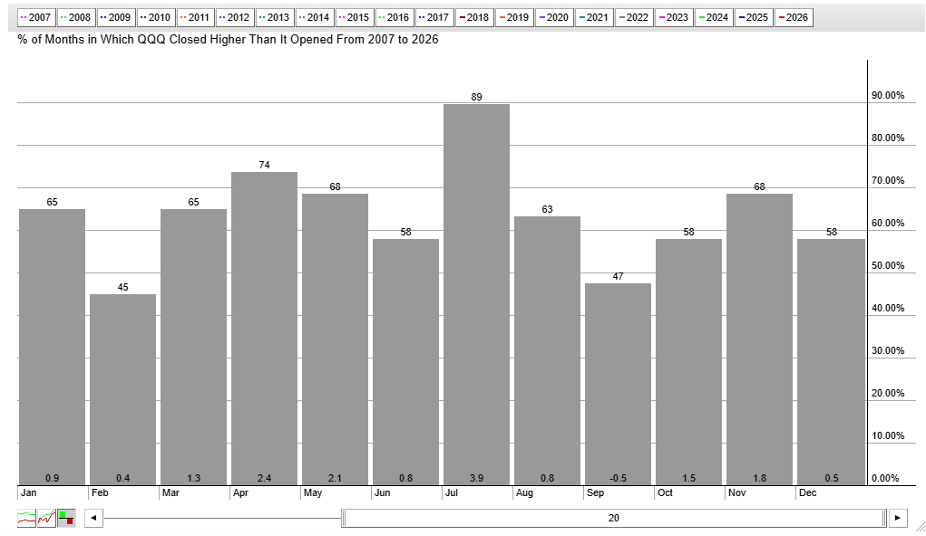
Finally, from a seasonal perspective, there is not much to glean from MAGS due to its recent inception. The Nasdaq 100 ETF (QQQ) offers clues, however.
So far, 2026 tracks right in line with last year. While it remains to be seen whether April delivers eventual rays of sunlight, the long-term trend is generally constructive in Q2. What’s more, May through July has been QQQ’s seasonal sweet spot over the past 20 years.
The Bottom Line
Traders would not normally associate soaring oil prices and a fledgling war in the Middle East with big-tech relative weakness, but that is the reality leading into Q2. Other macro factors and narratives may be at play, but it’s clear that the S&P 500’s fifth-worst year-to-date return since 1983 through last week is tech-led. Charts suggest further downside, but also bullish calendar trends, with the Q1 reporting period on the horizon.
Disclaimer: This blog is for educational purposes only and should not be construed as financial advice. The ideas and strategies should never be used without first assessing your own personal and financial situation, or without consulting a financial professional.


