The Market’s Middle Child Problem: Mid-Caps Flash a Warning
Key Takeaways
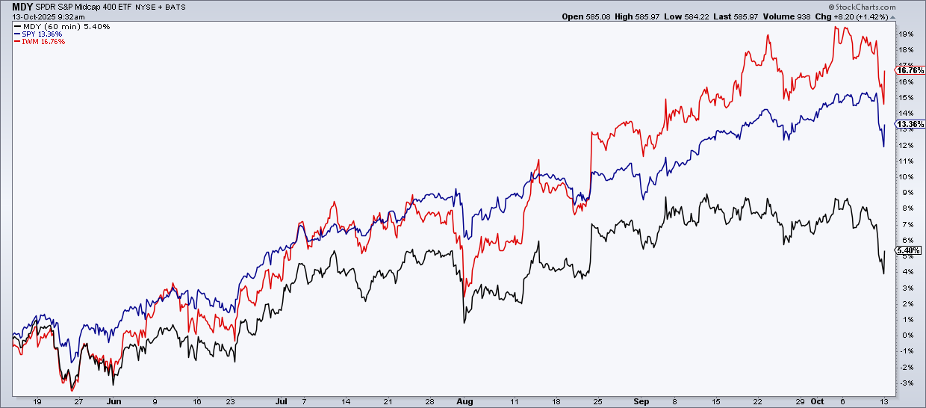
- Mid-caps have lagged, with the SPDR S&P MidCap 400 ETF (MDY) trailing both SPY and IWM since Q2
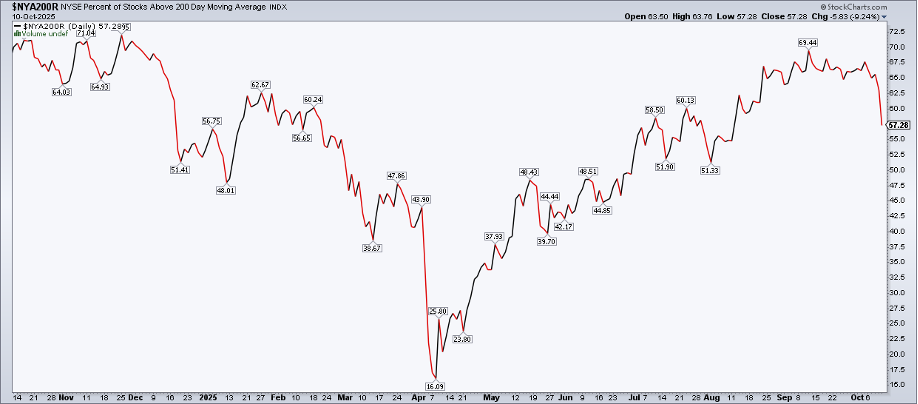
- Market breadth is thinning, evidenced by fewer NYSE stocks trading above their 200-day average, even as the S&P 500 hits record highs
- Quality stocks may be out of favor, but I outline what macro factors could offer a boost to the muddling mid-caps
The S&P 500 ETF (SPY) retraced 61.8% of its Friday plunge by the premarket on Columbus Day. The gap higher to begin the first week of Q3 earnings leaves investors on edge: Will it be a TACO-trade redux (with an aggregate buy-the-dip mentality), or is a trade-war-induced Q4 correction (like 2018) already underway?
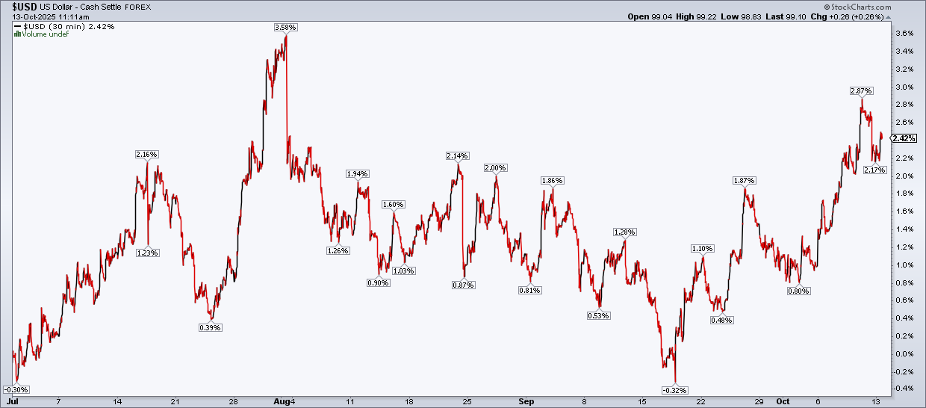
The Cboe Volatility Index ($VIX) has given back some of its gains from the end of last week, but the fear gauge remains uncomfortably elevated, near 20. The U.S. Dollar Index ($USD), meanwhile, is actually putting together a respectable second half, up 2.4%.
The focus this week will, of course, be on big bank Q3 profit numbers and the state of the consumer amid a dearth of official data. The AI trade is in the spotlight, too, with shares of semiconductor stocks swinging hundreds of billions of dollars in market cap daily. But I’m looking under the surface, and there are some concerning trends.
Where's the Weakness?
To close last week, the percentage of NYSE stocks trading above their 200-day moving average plunged more than nine percentage points to 57%. As the S&P 500 (and the total U.S. stock market) notched new record highs in September and into the first handful of days this month, fewer names were in technical uptrends.
But where is the weakness? Why is breadth, on some metrics, a turnoff for the bulls today? In short, blame it on quality.
For quarters on end, it seems the prudent advice has been to own high-quality, strong-balance-sheet companies that can weather macro storms. That has been a sage strategy among large caps. After all, the Mag 7 stocks boast fortress balance sheets, margins that most SMID caps can only dream of, and free cash flow so strong that they can easily embark on AI investments in the tens of billions of dollars.
Small-Caps and Mid-Caps Are Sending Signals
U.S. small caps and mid-caps are a different story. Mid-caps, specifically, have been left in the dust.
The SPDR S&P MidCap 400 ETF (MDY) is commonly left out of the size-factor conversation. The debate is commonly whether to stay big in the S&P 500 or overweight the Russell 2000. Mid-caps actually sport the best long-term returns across some academic studies that go back decades. The MidCap 400 Index also has a profitability screen (much like the S&P SmallCap 600 Index). Removing junkier companies sounds ideal in theory, but it has not been an alpha-generating methodology in practice recently.
Since mid-May, MDY is up just 5.4%, dividends included. Contrast that to SPY’s 13% gain and IWM’s +17% performance. As it often does, MDY has tracked the S&P 500 Equal Weight ETF (RSP) rather closely since the middle of the second quarter.
Pull up the StockCharts S&P 400 Market Carpet and you won’t find much in the way of speculative biotech stocks or hot AI plays. In the recent environment (perhaps driven by falling Treasury yields meeting attractive valuations), biotech has been absolutely lit. That industry is notoriously weak on the profitability metric, so MDY missed out on what has been a 61% rally in that high-risk corner of the Health Care sector. The SPDR S&P Biotech ETF (XBI) rose from under $67 in April to above $107 at its peak last week, XBI's best six-month jolt since 2021.
By contrast, IWM (which has an infamous 40%-plus holding in unprofitable stocks) has twice the Health Care access as MDY. Thanks to high-beta biotech and the notion that there will be many AI winners in small-cap tech and AI-adjacent sectors, IWM has beaten the steadier MDY by eight percentage points in the last five months.
Focusing on MDY’s technical situation, where do we go from here? It, like many of the broad-market ETFs, suffered its worst session since April last Friday. Unlike SPY or even IWM, MDY had not notched new record highs in the preceding days, however.
Notice in the chart below that playing it safe in SMIDs with MDY has not worked out since last November. The bulls have their work cut out for them to get the fund back to its late-2024 all-time high above $620. MDY printed a negative momentum divergence at its closing highs above $600 in September, then made a lower price peak in early October as the major indices reached fresh records.
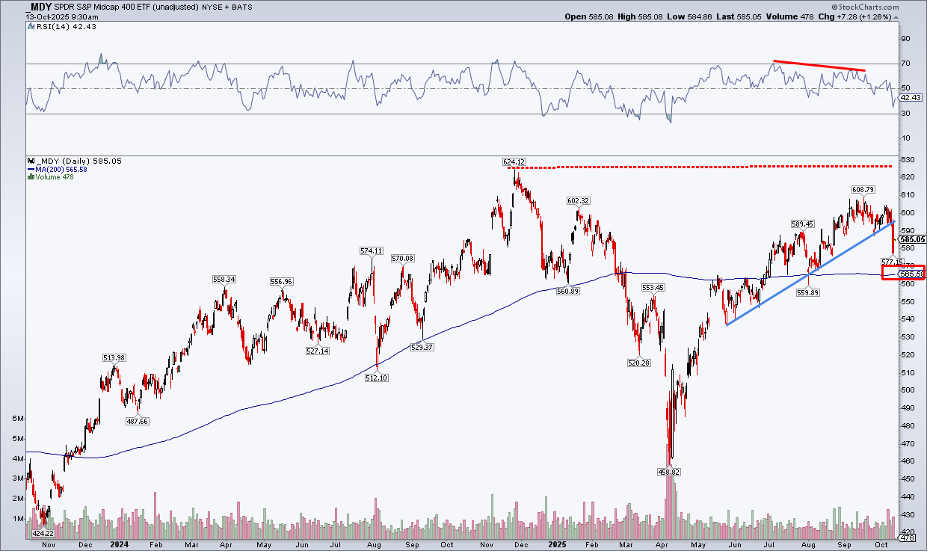
Today, MDY’s long-term 200-day moving average is merely flat in its slope, suggesting an ongoing battle between the bulls and bears. That's downright weak price action given the enduring global equity uptrend lately. Furthermore, MDY breached its uptrend support line from May, and there’s now a significant congestion zone up into the low $600s, which puts the onus on the bulls heading into year-end. The good news is that support appears in the mid-$560s, not too much lower from here.
What might it take for MDY to outperform? A pickup in U.S. economic growth expectations could do the trick. A rising dollar would help domestic stocks over international ones. Additionally, interest rates rising for the right reasons could cool off the speculative small-cap trade in favor of profitable mid-caps.
The Bottom Line
Mid-caps are on the struggle bus relative to the S&P 500 and Russell 2000 since Q2. The spotlight on AI-driven tech stocks, go-for-broke small caps, and gold and silver’s meteoric rise leaves steadier blue chips unloved. Friday’s potential breakdown on the chart was yet another concerning technical data point.
Disclaimer: This blog is for educational purposes only and should not be construed as financial advice. The ideas and strategies should never be used without first assessing your own personal and financial situation, or without consulting a financial professional.


