Megaphone Pattern + Death Cross: Bitcoin’s Technicals Flash a Warning

Key Takeaways
- Crypto has been under pressure, with two key chart developments being fodder for the bears
- “Out of control” bitcoin price action and a negative moving-average indicator point to additional downside
- Reversals can happen quickly in the space, though, particularly as year-end approaches
Bitcoin is now about flat on the year. The world’s most valuable cryptocurrency had boasted a YTD gain of more than 33% in early October, but “Uptober” turned out to be an upheaval for bitcoin bulls.
A slide below the psychological $100,000 level added fuel to the bearish fire, just as seasonal tailwinds were believed to be in full swing. Where does BTCUSD go from here? One technical pattern suggests there’s more downside to come.
The Rare Megaphone Pattern: Why Traders Should Pay Attention
The broadening top formation, also known as a megaphone pattern, is relatively rare. When it occurs, however, traders should take notice. Illustrated below on Bitcoin, it’s a situation in which price action turns volatile — some say “out of control.”
A series of higher highs and higher lows tricks bulls and bears alike, as false breakouts and breakdowns shake out loose hands. Ultimately, the broadening top proves to be distribution (or mass selling, which can transpire over the course of weeks or months).
Measuring the Downside: How the Chart Points to $75,000
Perhaps it’s fitting that bitcoin, an asset that carries ardent feelings and beliefs among its believers and non-believers, would give way to a megaphone pattern. Volatile disagreement between the bulls and bears plays out on the chart. In Bitcoin’s case, once it broke below $100,000, a downside measured move price objective was triggered. The target? About $75,000.
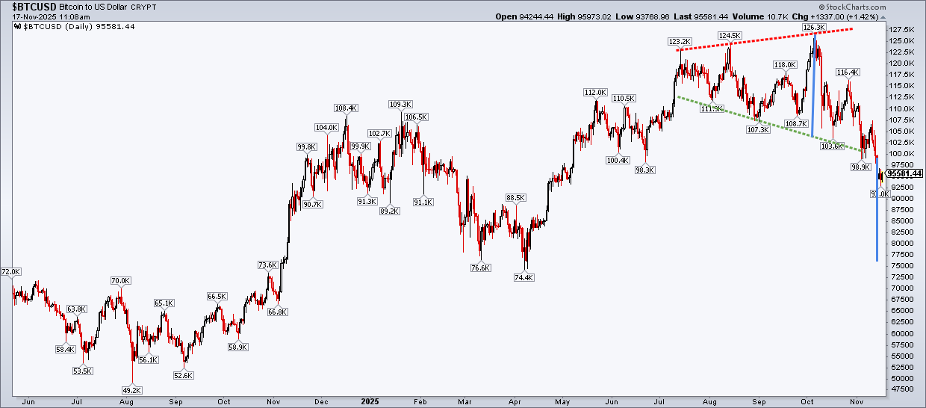
Here’s how we arrive at that target: Take the height of the megaphone pattern from its last high to the base. Then, once the breakdown happens, subtract the measurement from the breakdown price. In Bitcoin’s case, the broadening top’s range was about $25,000. Shave that off the, call it, $100,000 breakdown level, and we arrive at $75,000. That spot has confluence with the April 2025 low of $74,400 and would mark a 40% drawdown.
How soon could it unfold? The pattern doesn’t offer clues on its duration. What’s more, studies suggest that there’s high uncertainty with this type of technical development. Historical analysis tells us that price can revert to the meat of the previous range once a technical breakdown transpires. Thus, some technicians might even argue that it’s a continuation pattern more than anything.
A Second Bearish Signal: Bitcoin’s Death Cross Arrives
As always, traders must remain open-minded. Moreover, it’s useful to combine other technical indicators for better results. Unfortunately for crypto maxies (or anyone with a sizable long-term stake in the digital asset), this past weekend brought about another gloomy chart development, this one related to its key moving average.
A bitcoin death cross coincided with the broadening top pattern. As a reminder, a death cross is a bearish chart pattern that forms when a short-term moving average, typically the 50-day moving average, crosses below a long-term moving average, most commonly the 200-day. Unlike chart patterns, there’s no price target to be calculated. Rather, it’s more like a turnover on downs — the bears now possess the proverbial ball.
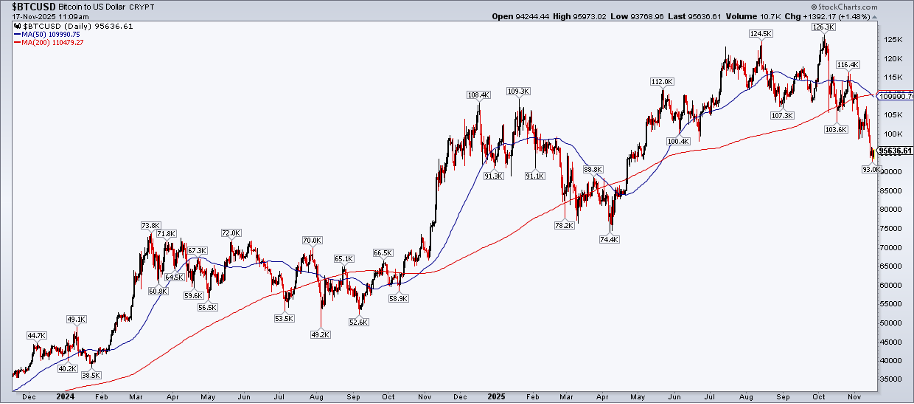
With a death cross (or a bullish golden cross), it’s an event that traders see coming. Moving averages, by their nature, trend. So, asset allocators could forecast that the falling 50dma would soon penetrate the rising 200dma. And, like with the megaphone pattern, the death cross is not a death sentence.
The previous death cross occurred on April 6, 2025, almost exactly when the entire crypto space bottomed. I’m encouraged that the 200dma remains on the rise — that tells me the bulls still hold some sway in the long-term trend.
Seasonality Fails to Deliver: A Bearish Red Flag
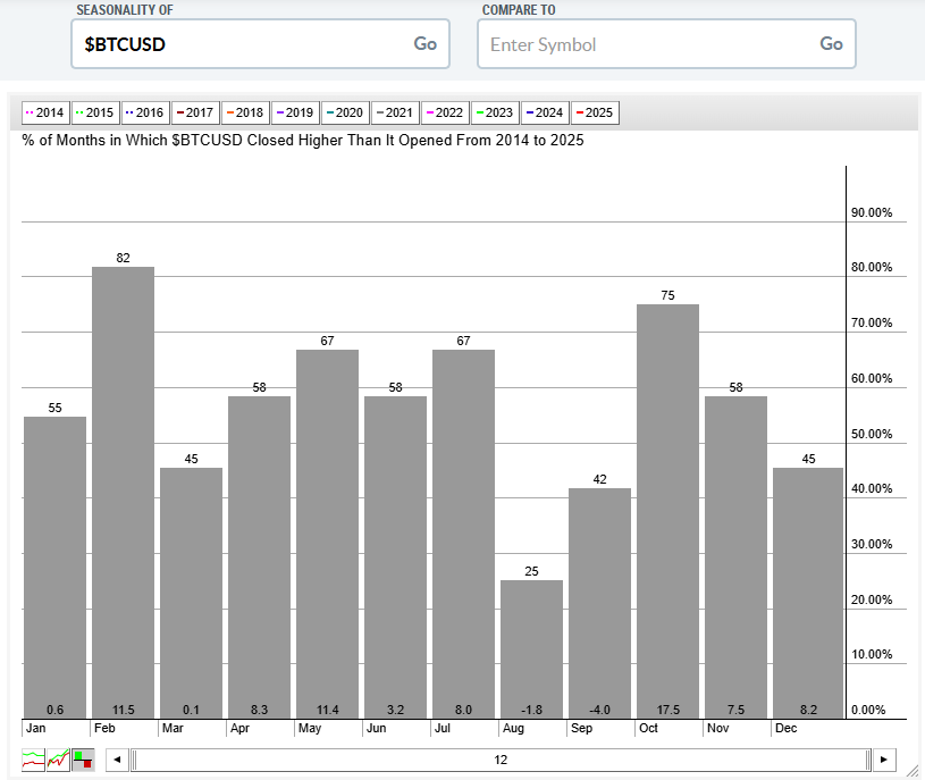
Bigger picture, it has been disappointing to see Bitcoin struggle during what’s, on average, a strong time of year. Using StockCharts’ seasonality tool, we discover that Bitcoin’s best set of back-to-back months has been October and November, sporting a cumulative gain of more than 20% in the first two months of Q4 in data going back to 2014.
Even recently, the bias has clearly been to the upside. Bitcoin bulls hope that unusual calendar trends persist through year-end, as December has been a lump of coal for the longs since 2018 — only December 2020 and December 2023 were up.
Watching Ether and Altcoins for Clues About Market Breadth
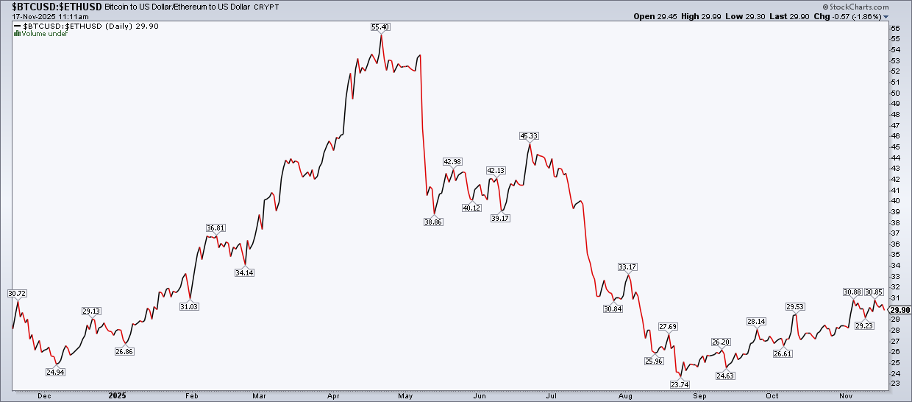
From an inter-asset perspective, it may be helpful to keep an eye on how riskier cryptocurrencies, such as Ether, perform against Bitcoin. If we see outperformance from smaller coins, that could bode well for the broader cryptocurrency asset class.
Furthermore, alpha among intensely volatile crypto-linked stocks could spark buying interest more broadly. For now, Bitcoin has posted modest outperformance to Ether over the past three months.
The Bottom Line
Bitcoin bears have plenty to be thankful for as we begin the back half of November. The digital asset notched a fresh high in early October, but that proved to be merely part of a broadening top formation. A death cross only fuels negative sentiment, while once-reliable seasonal patterns have been absent lately.
Could $75,000 be in play? Yes, but traders must view the entire technical landscape — Bitcoin reversals can be widowmakers for those caught on the wrong side.
Disclaimer: This blog is for educational purposes only and should not be construed as financial advice. The ideas and strategies should never be used without first assessing your own personal and financial situation, or without consulting a financial professional.


