Does this Technology Rally Have Legs?
In the last couple of months, we have seen a number of analysts and commentators point out that the current rally has been led by a handful of large-cap tech stocks and is therefore suspect. That observation suggests this week's extension to the advance is doomed. It's certainly true that a market advancing on weak breadth is normally vulnerable, and we would certainly prefer to experience a more broadly-based advance. However, whenever market attention is so widely focused on a particular relationship or sector, it is usually wiser to expect the outcome to materialize in a different direction. Also, we need to give some time for the broader market of technology stocks to catch up. Only when the index in question breaks trend do we have to worry about negative divergences, and the trend in the Technology ETF right now looks like it is headed in a different direction.
One of my favorite long-term approaches is to calculate a PPO using the 6- and 15-month parameters. When it crosses zero, we usually get a relatively whipsaw-free result. I use the word "relative" because it is impossible to eliminate all false signals in any indicator. The fact is that the PPO for the SPDR Technology ETF has just crossed zero. I don't know how long it's going to remain there, but this upside momentum should pushed the price higher in the immediate future.
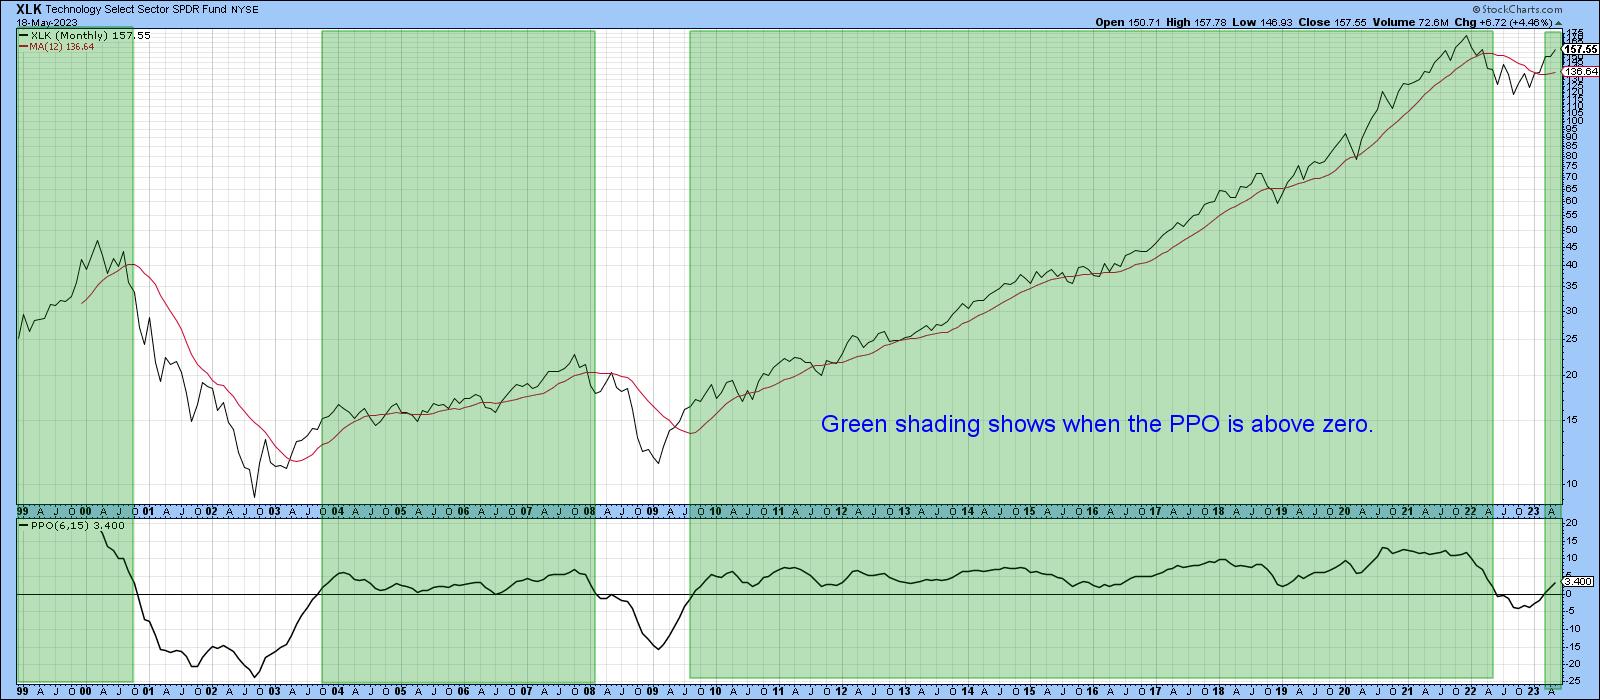
Chart 2 shows that the XLK is above its 65-week EMA and has broken out from a nice base. During last year's bear market, relative action corrected, but is now at a new high. The thing I like about it is that the long-term KST for relative strength, in the bottom window, has just gone bullish from a subdued level. The long-term KST for the absolute price has also started to rally, and is also supporting the idea of higher prices.
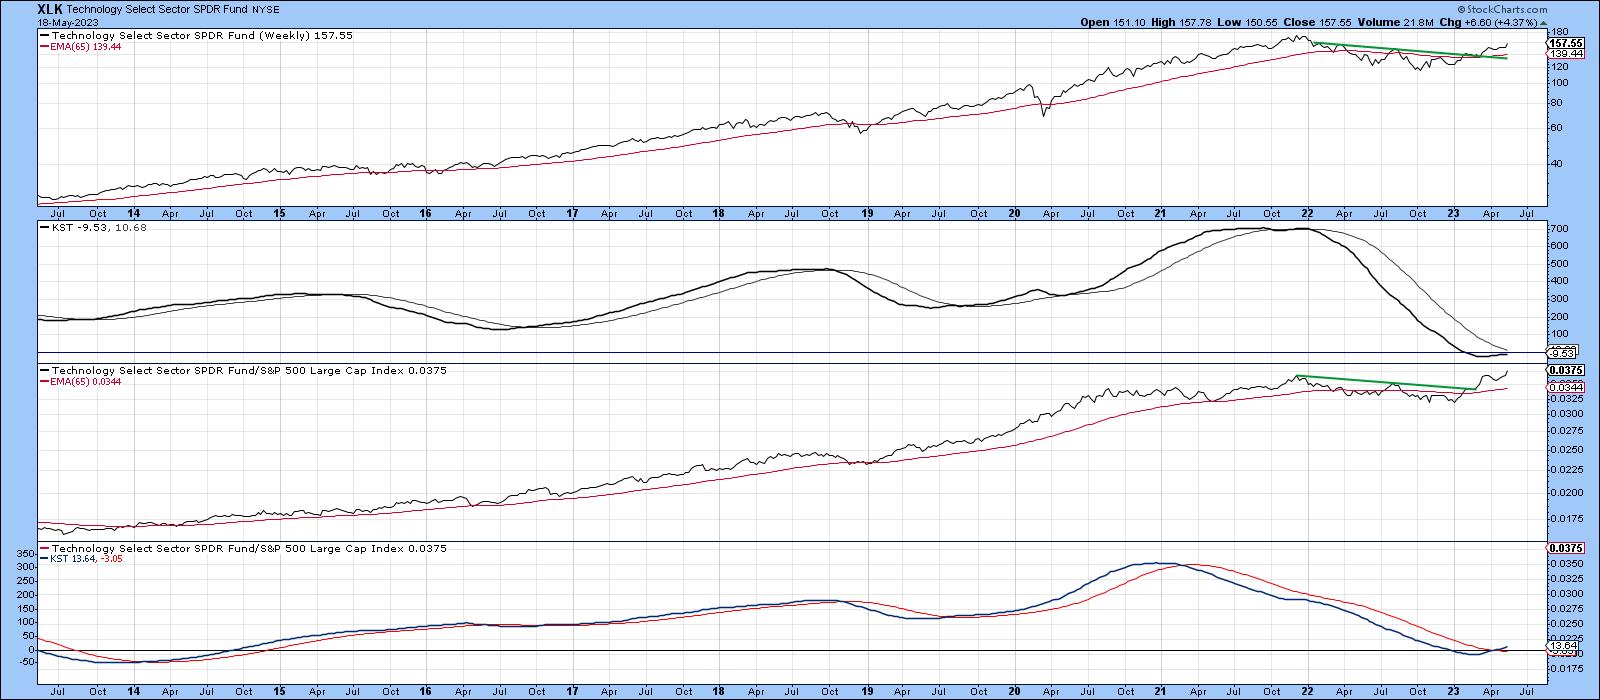
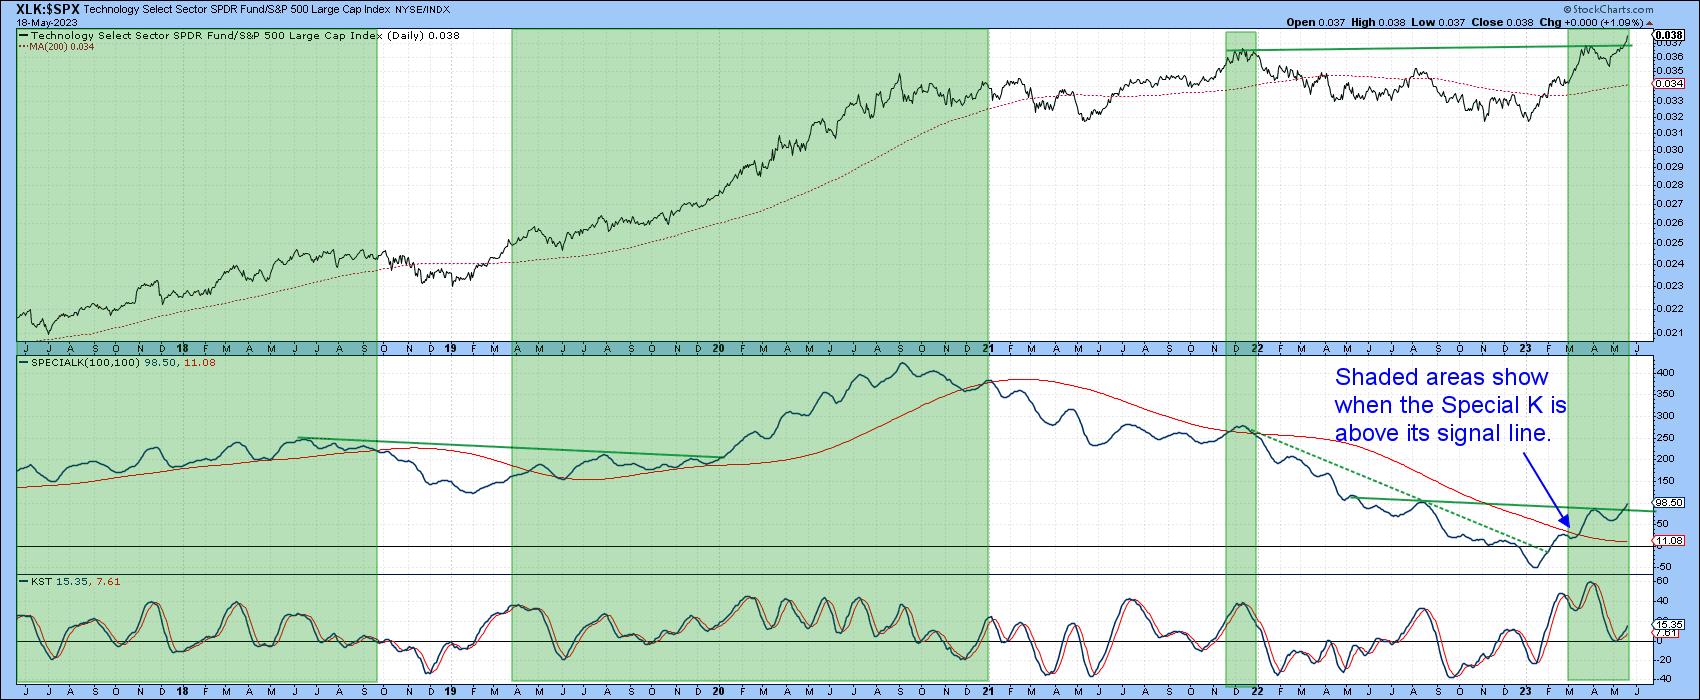
Chart 3 also displays relative action for the Technology ETF, but this time I have plotted a Special K indicator (SPK), which you can read about here. The chart shows several things. First, the RS line has broken out to a new high. Second, the SPK is trading above its signal line and therefore qualifies for some bullish green shading. Third, it is just breaking out from an inverse head-and-shoulder pattern. Finally, the daily KST in the bottom window recently touched a multi-year high, which further confirms that the bear market in relative action is over. That indicator has also just given a buy signal.
Shorter-Term Considerations
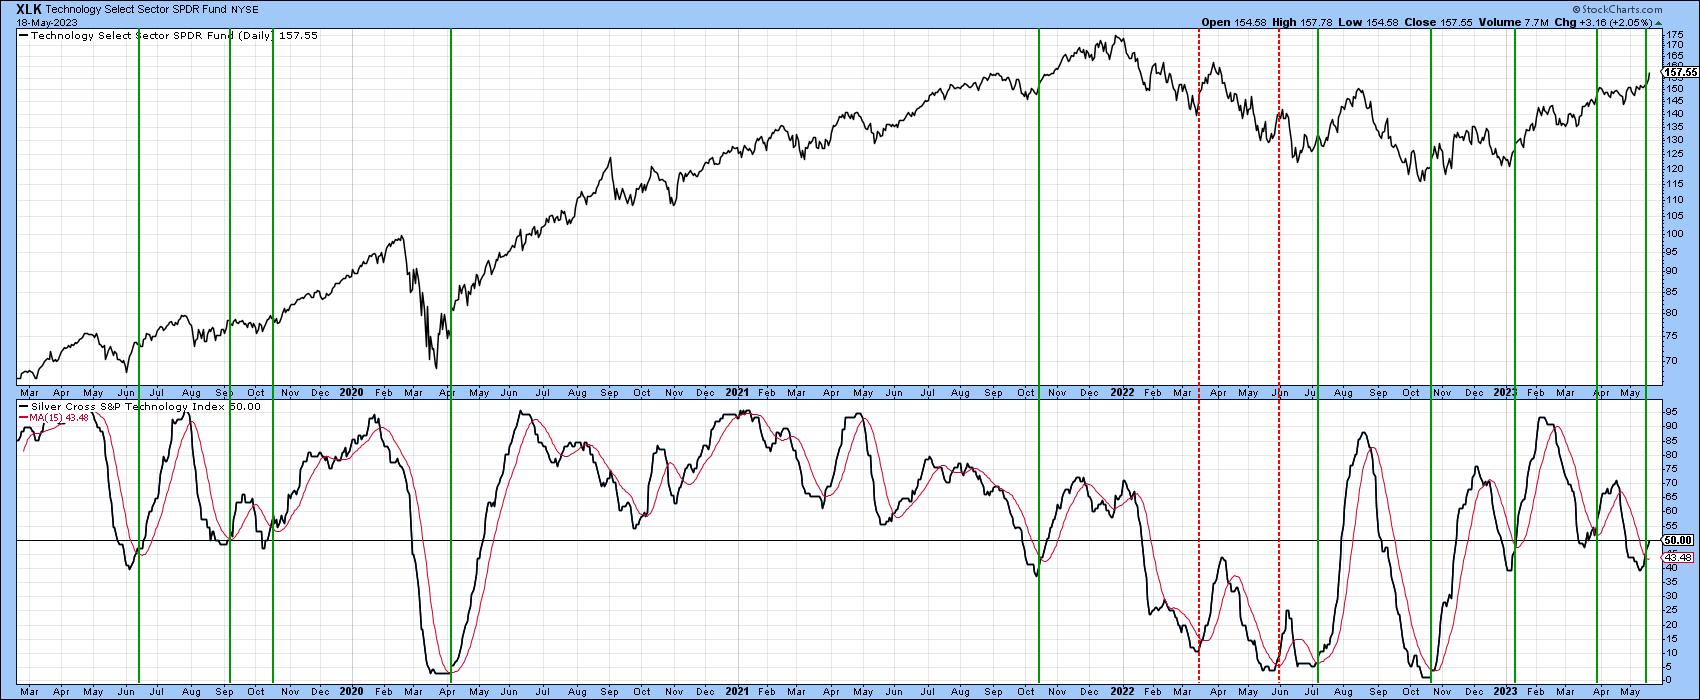
Some of the shorter-term indicators have also begun to pick up. For example, Chart 4 tells us, the Silver Cross indicator for technology has just crossed above its 15-day MA. The green vertical lines indicate that the odds of a rally are raised when this occurs from a position at below zero. The two failed signals developed during the bear market.
Net new high data in Chart 5 shows huge support for the recent breakout. with numerous XLK components touching 52-week new highs.
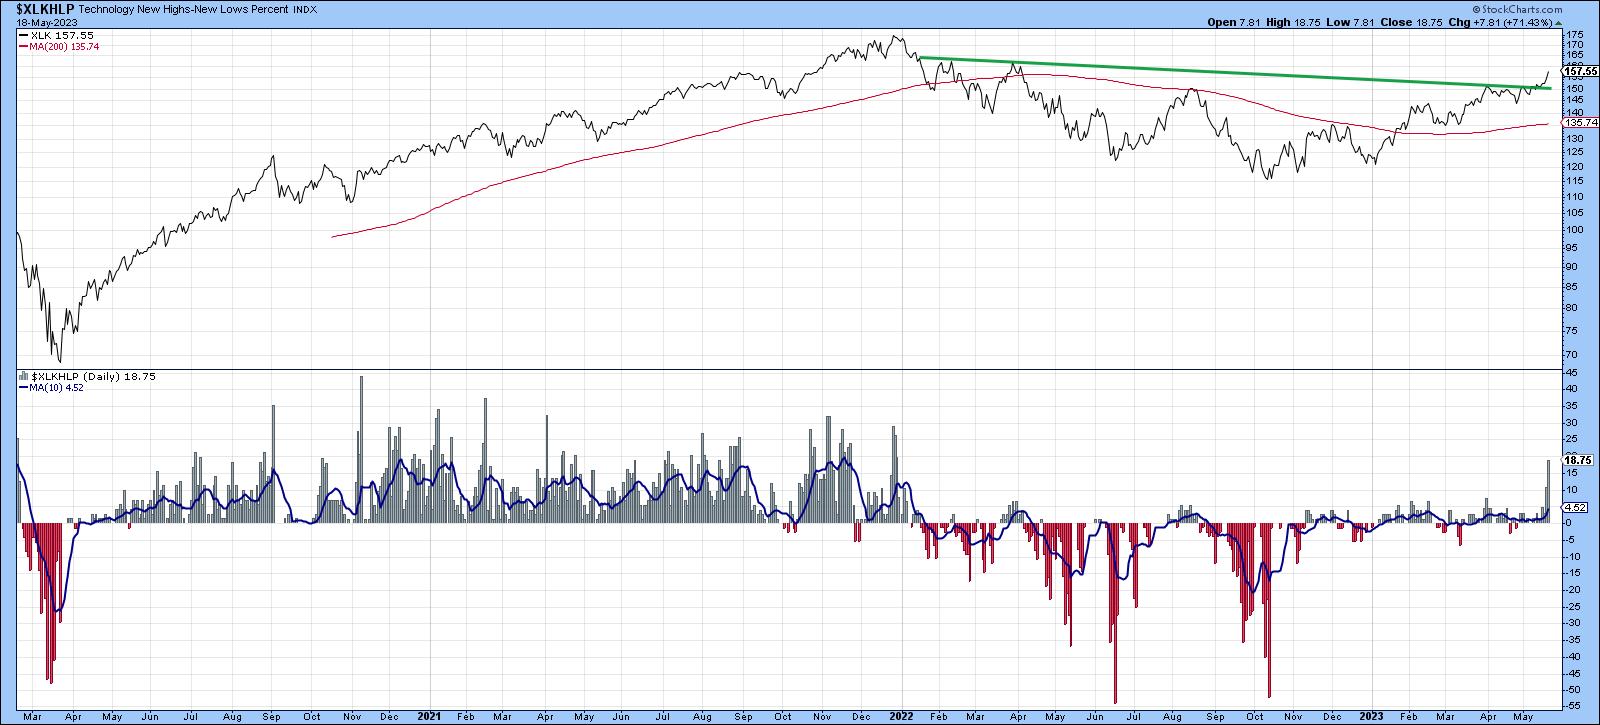
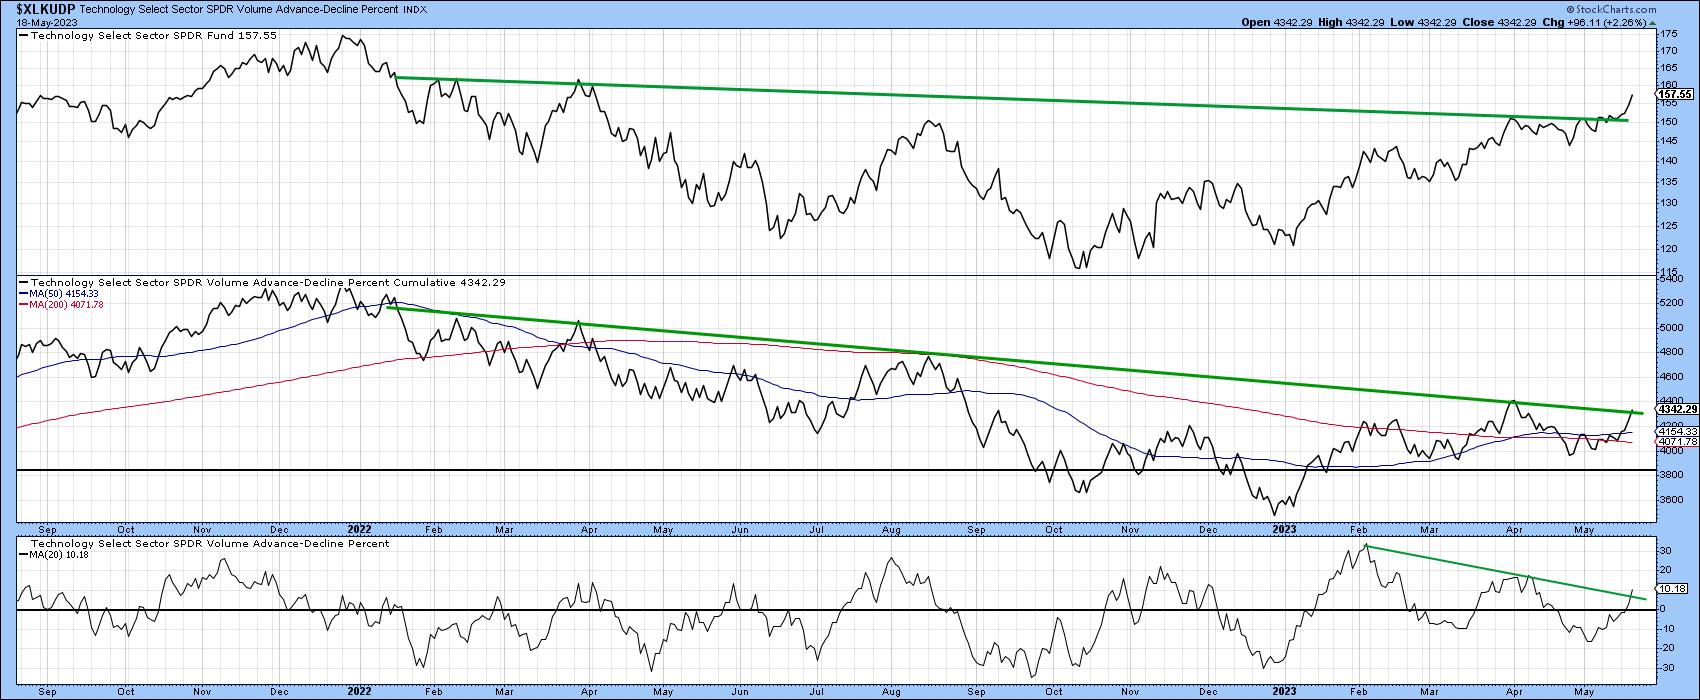
Chart 6 compares the XLK to its percent volume cumulative advance decline line. The indicator is starting to edge its way above that secondary bear market trendline and probably will, since the 20-day ratio of the line has experienced a slightly more decisive breakout.
NASDAQ Outperforming the Dow is Bullish for the Overall Market
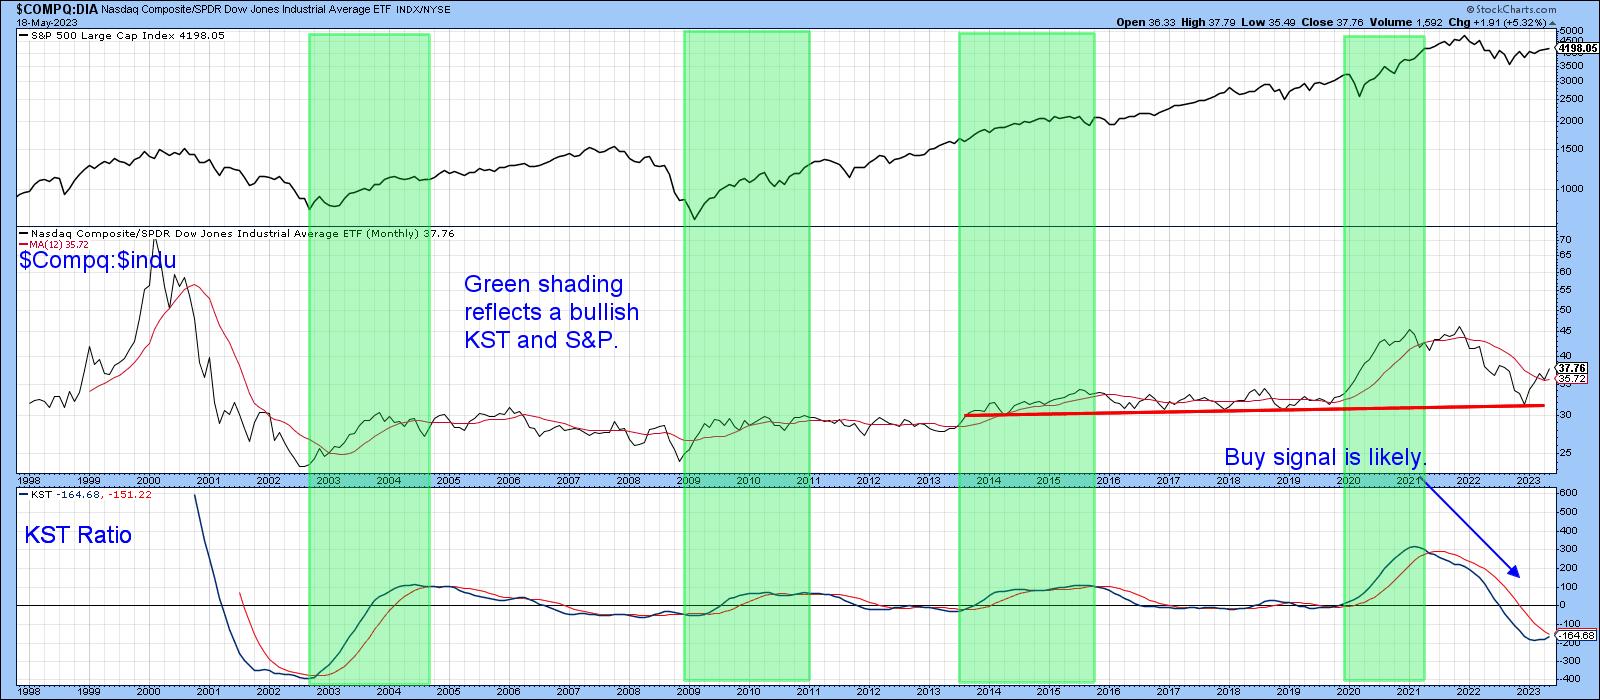
Finally, Chart 7 compares the S&P Composite to the ratio between the tech heavy NASDAQ and the Dow. The green shadings approximate when the KST for the ratio is above its MA. In the vast majority of situations, this superior performance by the more speculative NASDAQ stocks has resulted in an advance for the S&P Composite. The KST hasn't quite got there yet, but, given the strong technical position of the XLK, a positive crossover appears likely.
Good luck and good charting,
Martin J. Pring
The views expressed in this article are those of the author and do not necessarily reflect the position or opinion of Pring Turner Capital Groupof Walnut Creek or its affiliates.


