Gold is at the Crossroad
Last November and December, it looked as if gold had broken out from a multi-year inverse head-and-shoulders. Since then, the price has dropped below the breakout area, and the long-term KST has begun to roll over.
Just like takeoff and landing are the critical points for an aircraft, breakouts are one of the most dangerous moments for financial markets. If prices remain above the breakout point and extend their advance, the uptrend is likely to extend. On the other hand, failure to remain above the breakout point throws up the possibility of a whipsaw. False starts such as this are typically followed by above-average price moves, as incorrectly positioned market participants attempt to get back to the right side of the market. There are occasions, though, when the price, having temporarily pushed through resistance, re-groups and makes another attempt at the breakout.
In technical analysis we deal in probabilities, which are determined by the weight of the evidence. In this instance, the breakout is a positive piece of evidence and the failure, so far this month, to hold above the breakout point is a negative one. Since we assume the prevailing trend is in force until the evidence proves otherwise, the benefit of the doubt at this point is given to the uptrend. To get a guilty verdict, some additional negative evidence is required. That confirmation can take many forms but most commonly comes from a reliable moving average crossover or a trendline break and so forth. A trend in which the price regroups and moves to new highs is generally on more solid footing than breakouts that are not subject to such successful downside testing.

Gold's recent breakout was significant since the neckline extended over several years and turned back four rallies. If the late 2023 breakout turns out to be false, that's an equally big deal in a negative sense. So far, the price has offered little in the form of confirmation, since the price remains above its 12-month MA and the long-term KST, whilst flattening, has remained above its signal line.
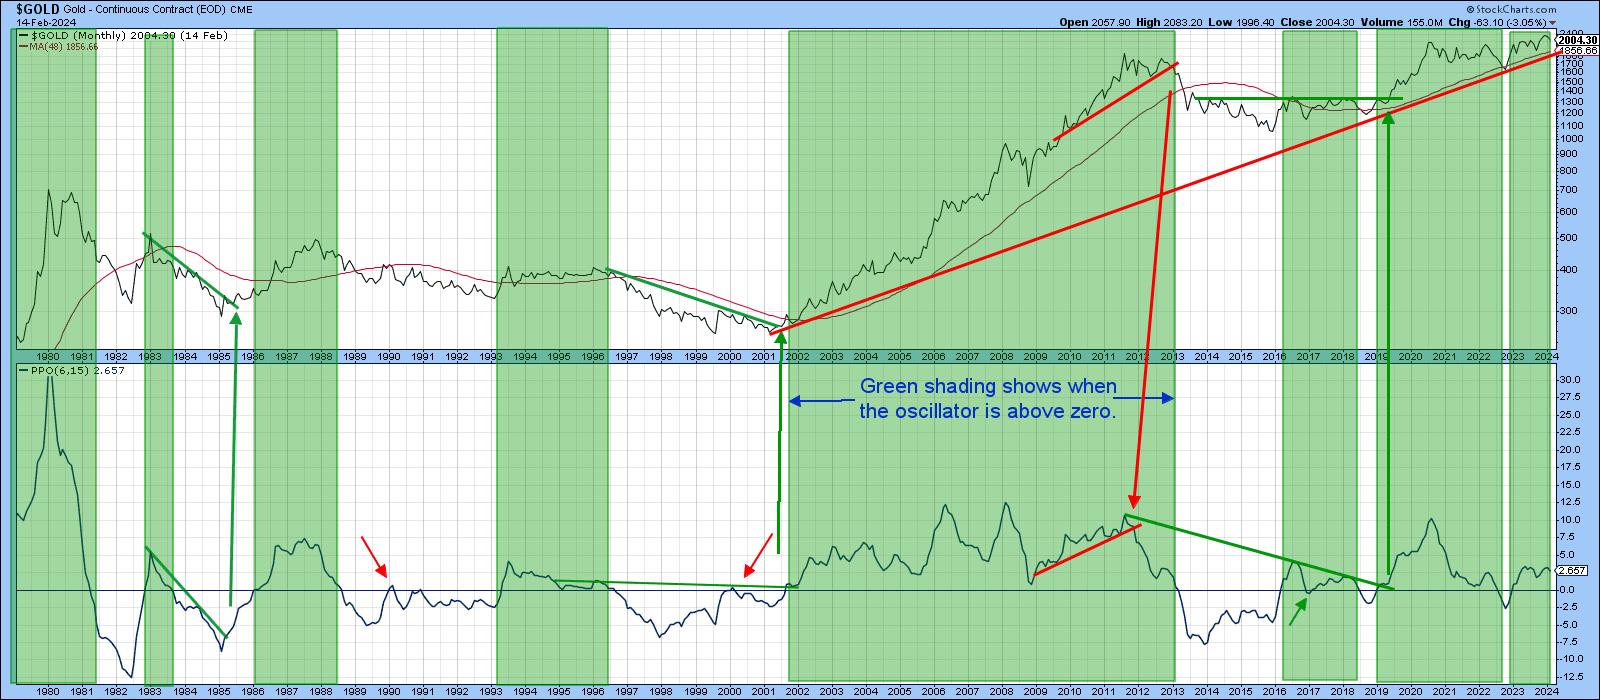
The green shadings in Chart 2 tell us when the PPO, using the 6 and 15-month parameters, are above zero and the small arrows, those few examples of false crossover that have developed in the last 35 years. Note that pretty well all of the extended declines that have taken place have been confined to the unshaded areas when the oscillator was below zero. Right now, it's comfortably above the equilibrium point and supporting the possibility of a re-test of the breakout. You can also see the secular uptrend dating from the turn of the century and the 48-month MA are both intact. They are currently around the $1850 area.
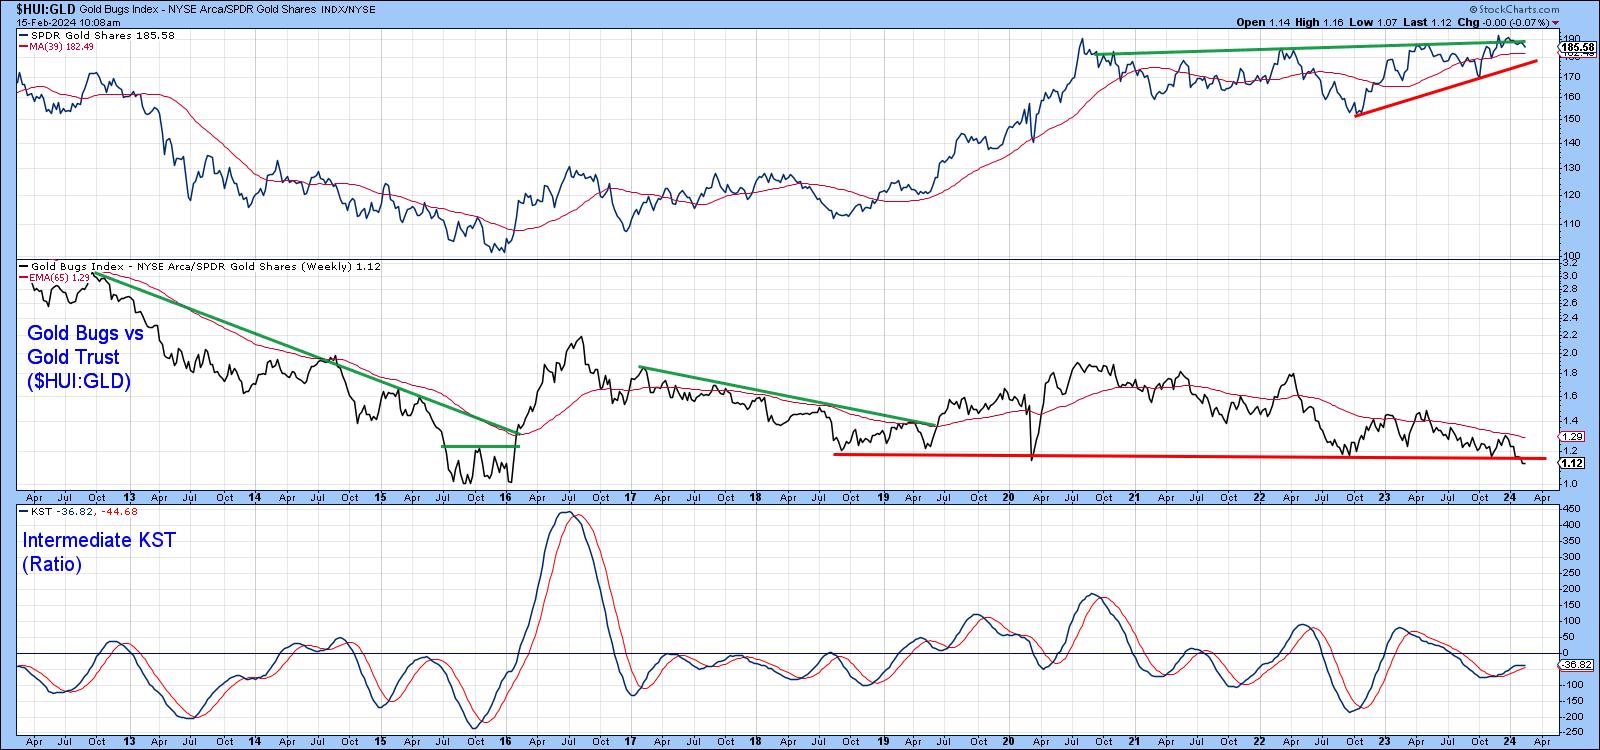
The upper window in Chart 3 plots the price using using weekly data. The up trendline and 65-week EMA are still intact, so once again there is no confirmation of a false break.
Recent action for the ratio between the Gold Bugs Index ($HUI) and gold itself (GLD) is troubling, though. That's because $HUI components downplay hedging their production and are therefore a lot more exposed to fluctuations in the gold price itself. Consequently, when this index underperforms gold, it signals a vote of no confidence, indicating the price of the yellow metal is unlikely to rise. This week, the ratio tentatively violated a multi-year support trendline and is now on course for a test of the lower part of the late-2015 trading range. The rising KST hints that the downside break could turn out to be false.
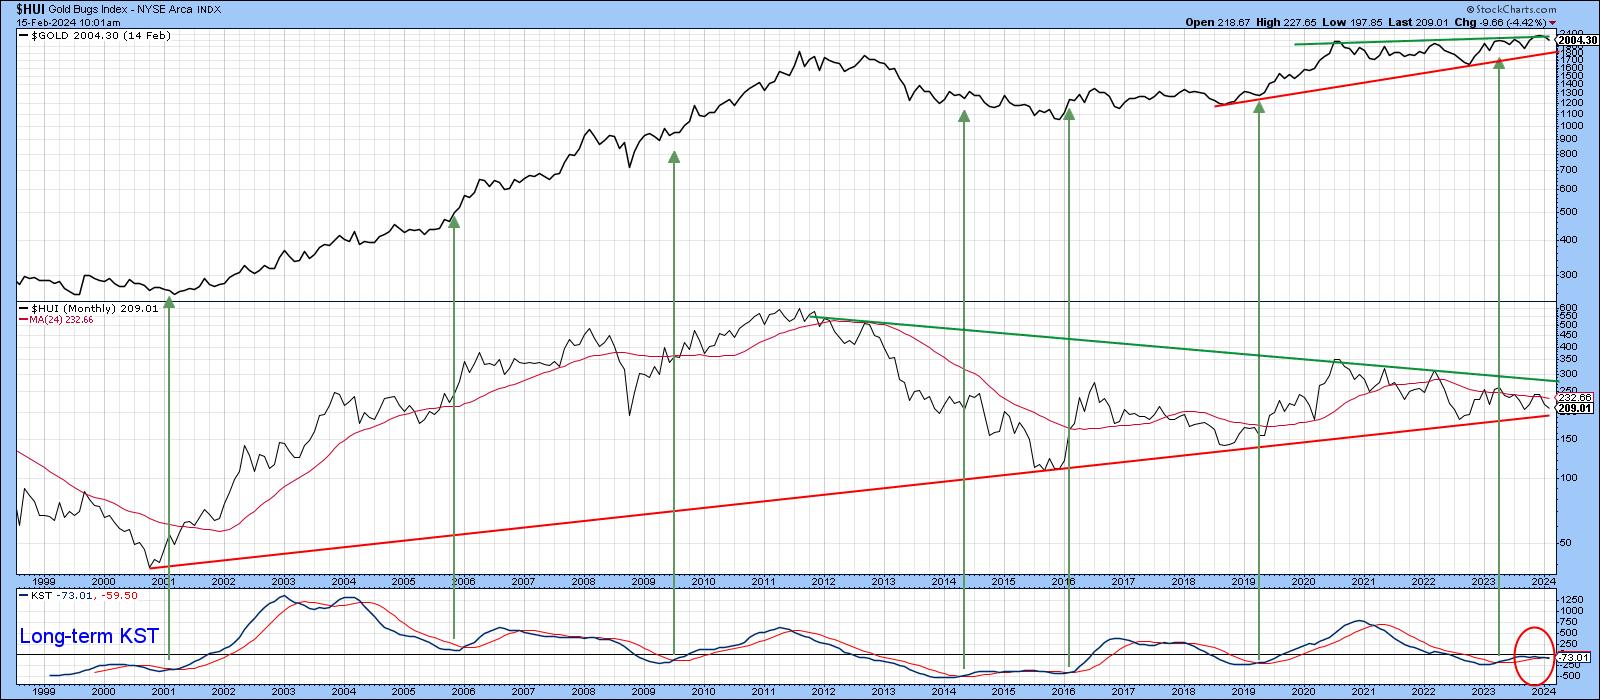
The stakes for the Index itself could not be higher, as Chart 4 shows it has fallen back towards its 2001-2024 secular up trendline. Note that the $HUI and the gold price traveled in tandem during the 2001-2012 bull market, but, since 2021, gold has zig-zagged higher, whereas the $HUI has moved in the opposite direction. The current tight balance between buyers and sellers is indicated not only by the $HUI reaching key support, but by the completely flat long-term KST.
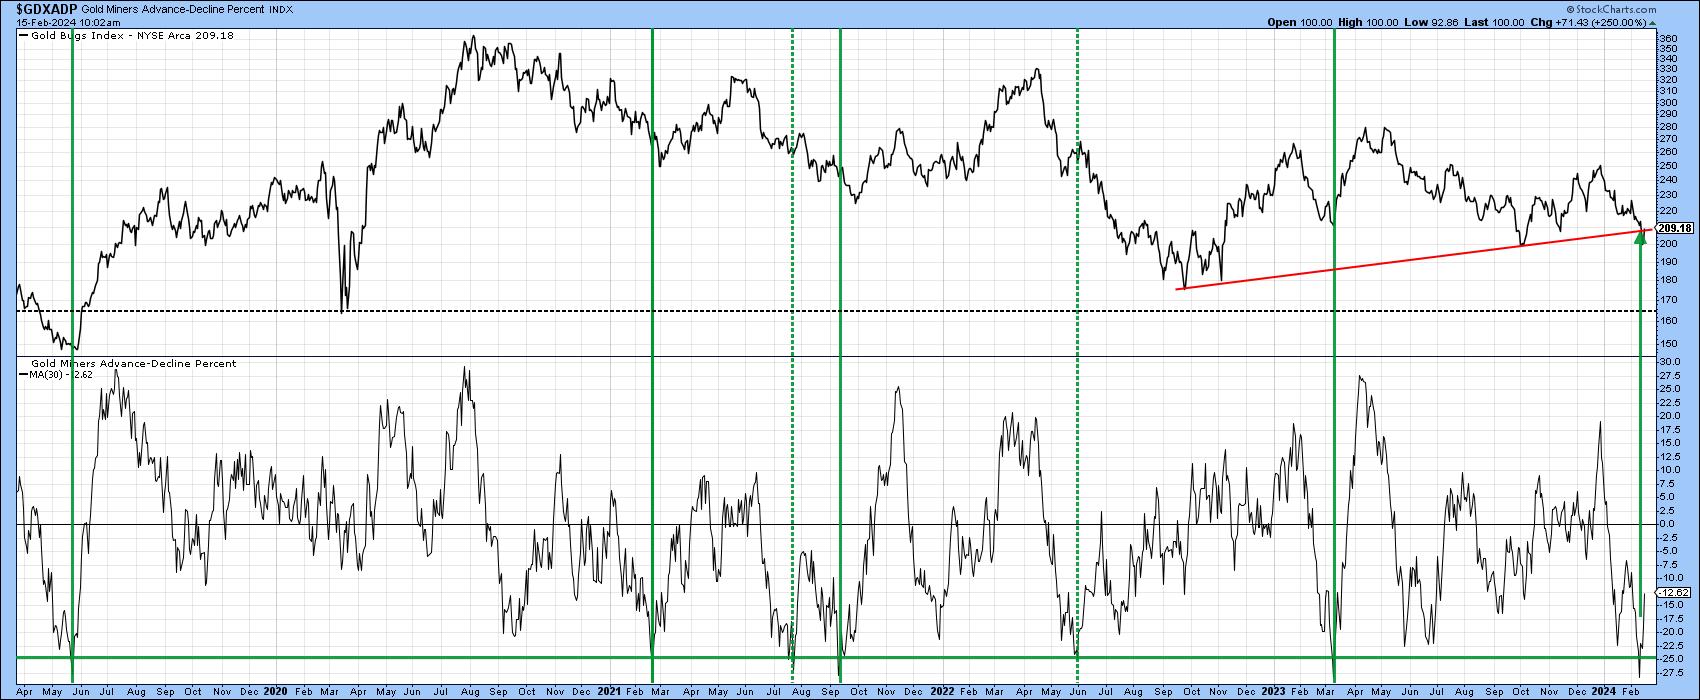
Finally, Chart 5 offers some hope for the bulls, since it shows the 30-day MA of the Gold Miners A/D ratio has reversed from an oversold condition for the seventh time since 2019. Four of those occasions were followed by nice rallies in the Index; two were not. In addition, the Index is also resting on a 2-year up trendline. Consequently, it's nail-biting time for those with a bullish inclination!
Good luck and good charting,
Martin J. Pring
The views expressed in this article are those of the author and do not necessarily reflect the position or opinion of Pring Turner Capital Group of Walnut Creek or its affiliates.


