These Commodities are On Track for Mega Breakouts in May
It's rare when you see a multi-year breakout take place, but, when several materialize more or less at the same time, that should really get our attention. That's not simply because of the opportunities being presented, but also because several simultaneous breakouts indicate a broader participation and, therefore, a greater probability that the individual breakouts are genuine. It's also important to add that the charts featured here are based on monthly data, which require a month-end close for an official plot. That said, we have not reached the end of the month yet, and are therefore missing price action for several session--hence the "on track" as part of our title.
Gold
It's a well-known fact that the gold price has recently broken above a multi-year resistance trendline, as shown in Chart 1. That breakout suggests the price is headed significantly higher over the course of the next business cycles.

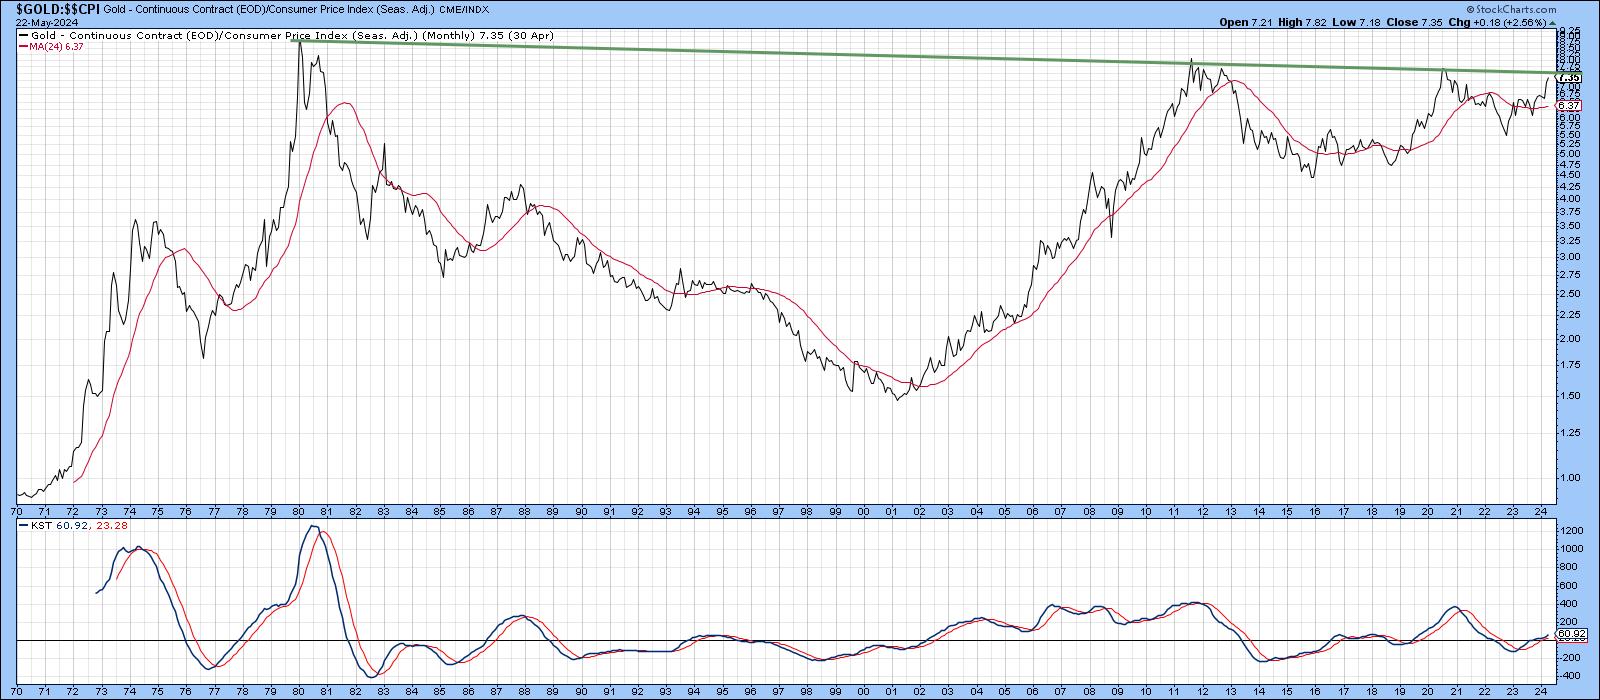
However, an even more significant breakout could be close at hand when gold is adjusted for inflation. In that respect, Chart 2 shows the price is right at a resistance trendline, joining the 1980, 2011, and 2020 peaks. Note that the long-term smoothed momentum (KST) in the bottom window has only just turned bullish, which suggests an upside break is in the cards. Since gold discounts political uncertainty and inflation, a breakout would not provide a happy message.
Copper
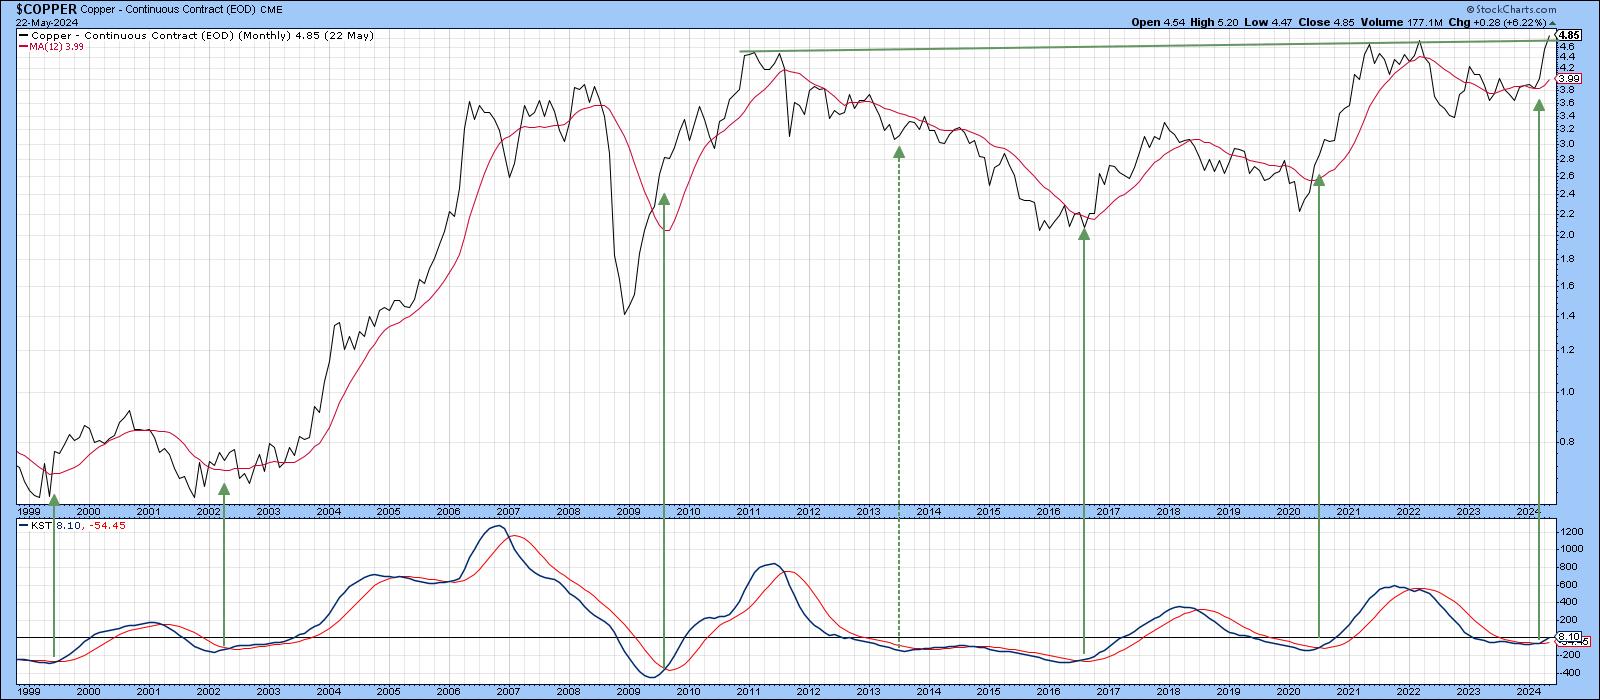
Copper is a key commodity because it is used worldwide and in many diverse industries. Research shows a strong correlation between copper prices and global economic activity, especially in China. Chart 3 shows that copper is toying with a multi-year resistance trendline and has tentatively edged above it. The arrows indicate KST buy signals, one of which offered a false positive in 2013. At that time, the price was trading below its 12-month MA, which is not the case currently. That suggests the current buy signal will turn out to be genuine.
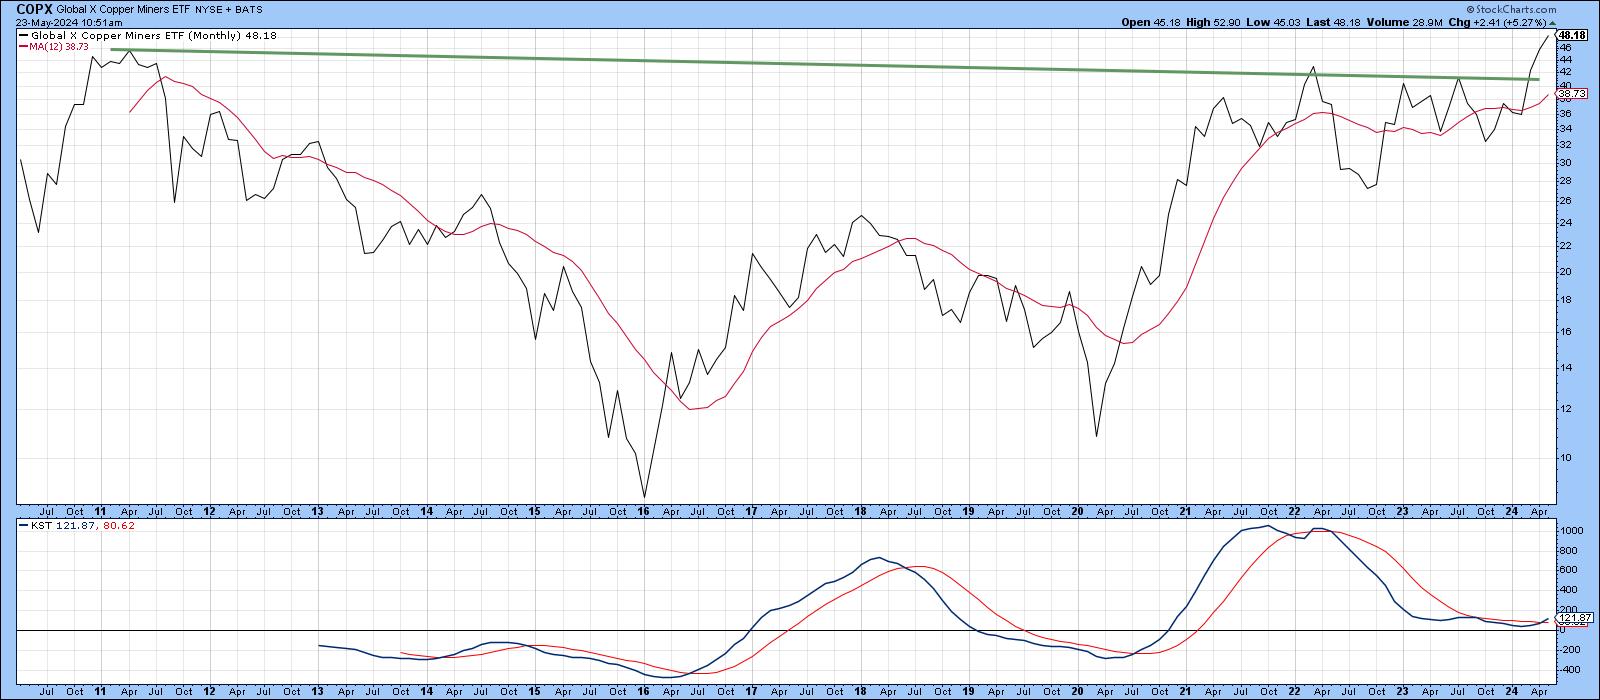
Copper miners are also adding to the bullish copper case, as Chart 4 indicates the Global X Copper Miners ETF (COPX) broke above its secular resistance trendline last month and has built on that strength in May. It is clearly leading the price of the metal higher.
Silver
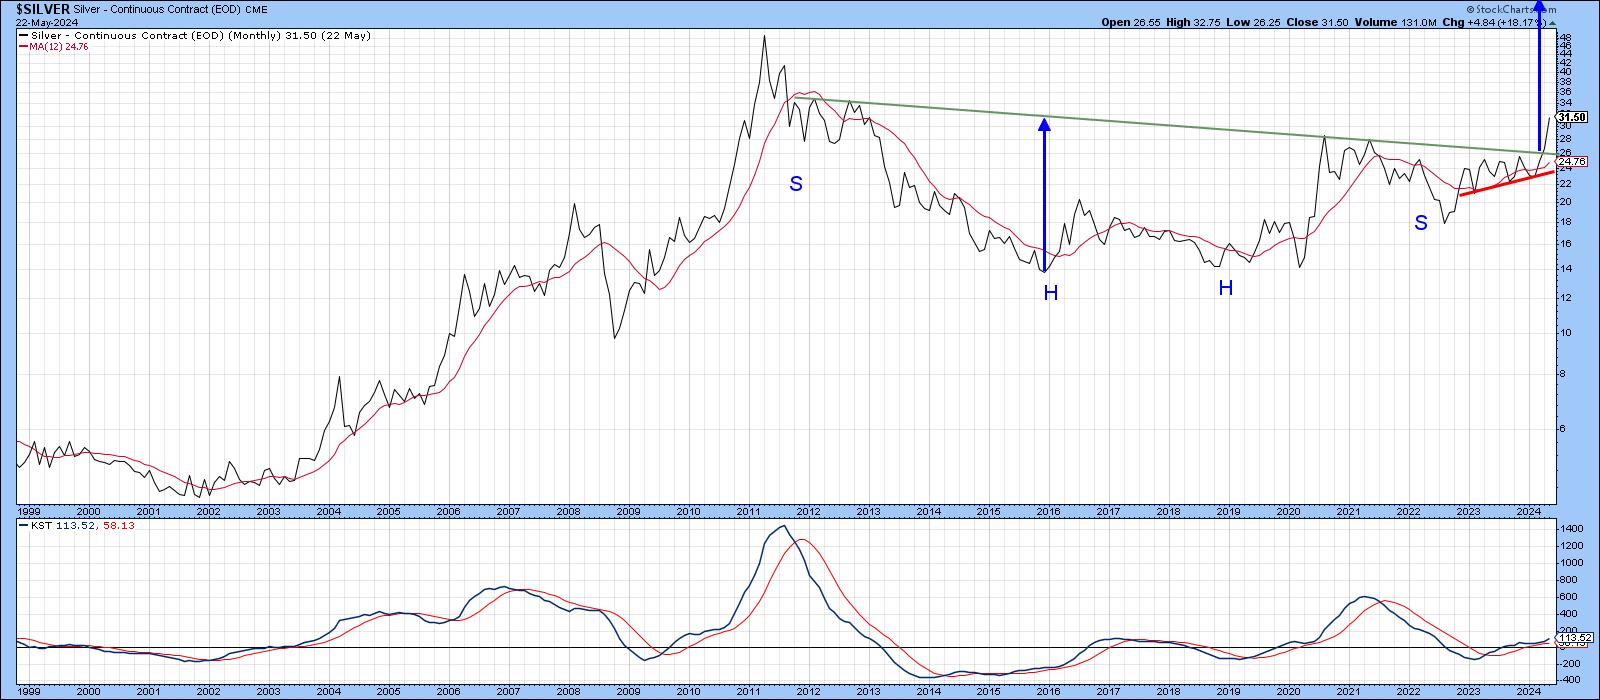
Silver also broke out in April and moved higher in May. The whole trading action since 2011 could be interpreted as a giant inverse head-and-shoulders, with an ultimate upside objective that is literally off the charts. The long-term KST, like that for copper, is at a fairly subdued reading and is not therefore in any way overstretched, which suggests the recent breakout is valid. Markets are driven by psychology and, like people, can and do unexpectedly change their mind. In silver's case, it would be reasonable to conclude that an invalid breakout had materialized in the unlikely event of a downside penetration of the red up trendline. It is currently around $24.
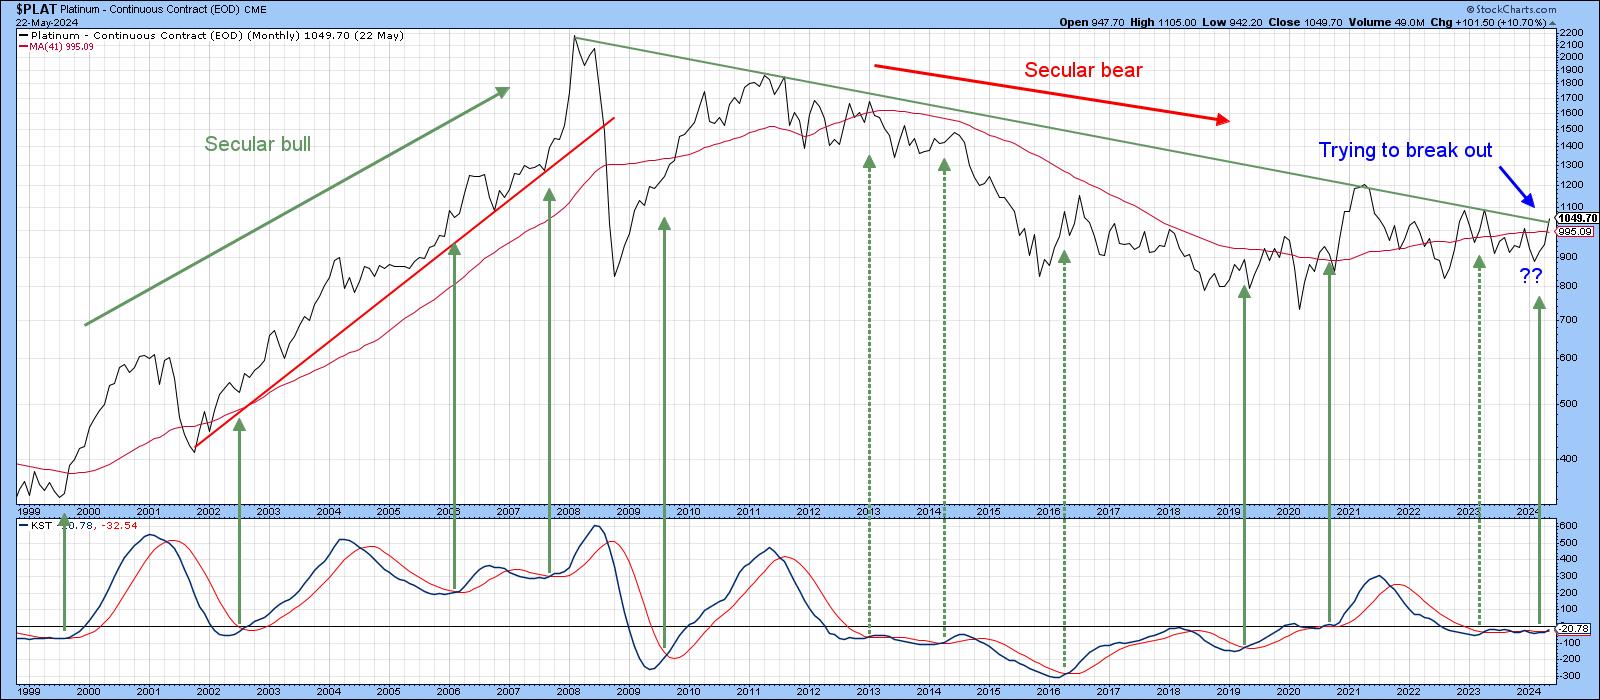
Platinum
Platinum has been in a secular downtrend since 2011, but is currently toying with its secular down trendline. A tentative long-term KST signal has also been triggered. The solid arrows reflect crossovers that were followed by a rally, and the dashed ones failed signals. Note that all the failed ones occurred under the context of a secular bear market, when primary trend signals such as this are expected to be sub-par in both magnitude and duration.
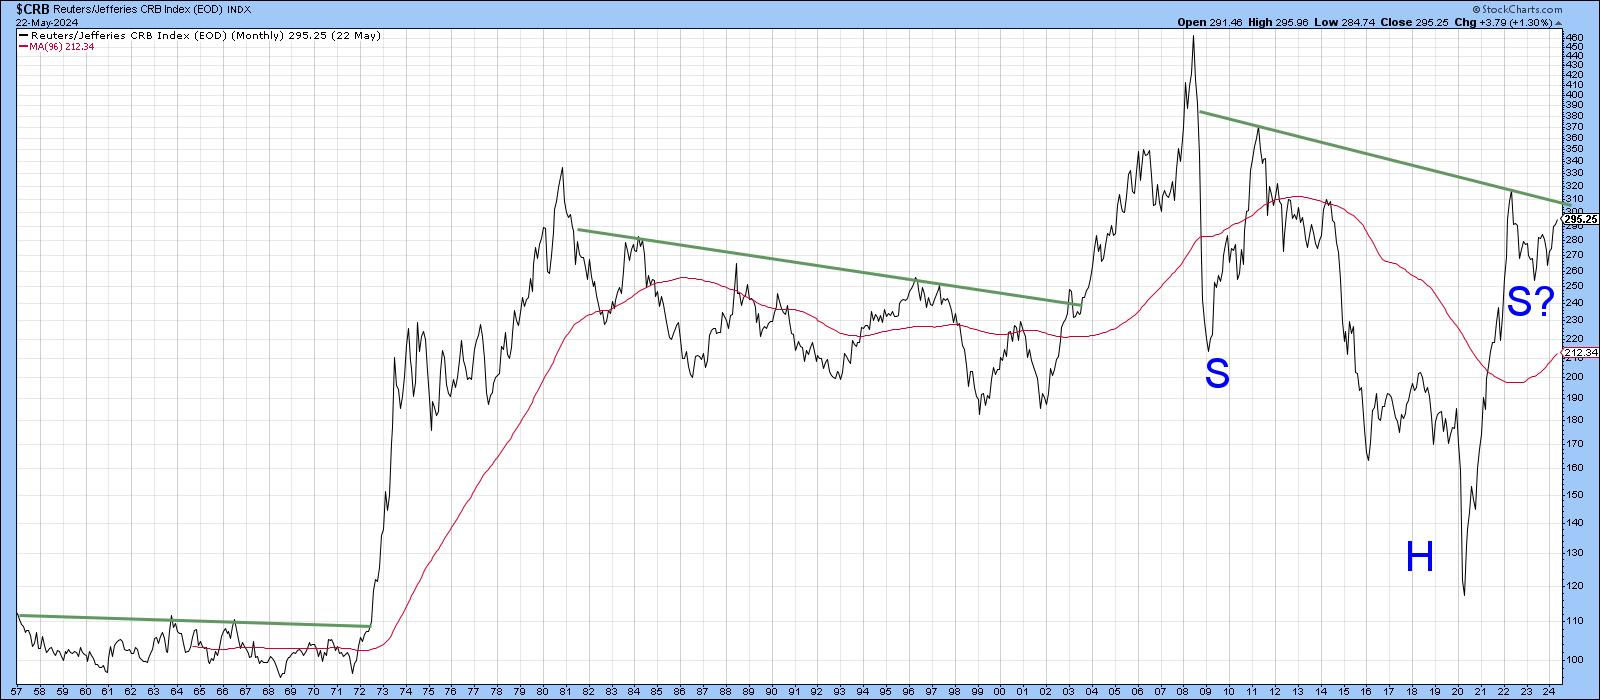
CRB Composite
The commodities covered here have all been part of the metals sector. However, Chart 7 shows that the more broadly based CRB Composite may be in the terminal phase of completing a giant downward-sloping inverse head-and-shoulders pattern. The stakes could be high, because the Index has experienced two major breakouts since the 1950's, both of which were followed by a spirited and lengthy advance. Nevertheless, it's not my idea of a nicely formed pattern, since the right shoulder activity is limited when compared to the potential left shoulder. However, a decisive month-end close above the neckline at 307, or better still above the previous high at 316, would likely set in motion a serious extension to the post-2023 rally.
Good luck and good charting,
Martin J. Pring
The views expressed in this article are those of the author and do not necessarily reflect the position or opinion of Pring Turner Capital Groupof Walnut Creek or its affiliates.


