Did We Just See a False Breakdown in Crude Oil?
Using West Texas Crude, Chart 1 features one of my favorite techniques for identifying changes in long-term trends, which is simply a PPO using the 6- and 15-month parameters. When it is above zero, it's bullish, and when below, bearish. The pink shading indicates bearish periods, and the blue arrows the occasional whipsaw. Right now, the trend is bearish because the PPO is negative, and the price is trading below its 24-month MA. However, the price recently tried to drop below its 2021-24 trading range, though it has since pulled back above it. My conclusion is that while the trend is currently bearish, it would not take much in the form of price action to turn it bullish.

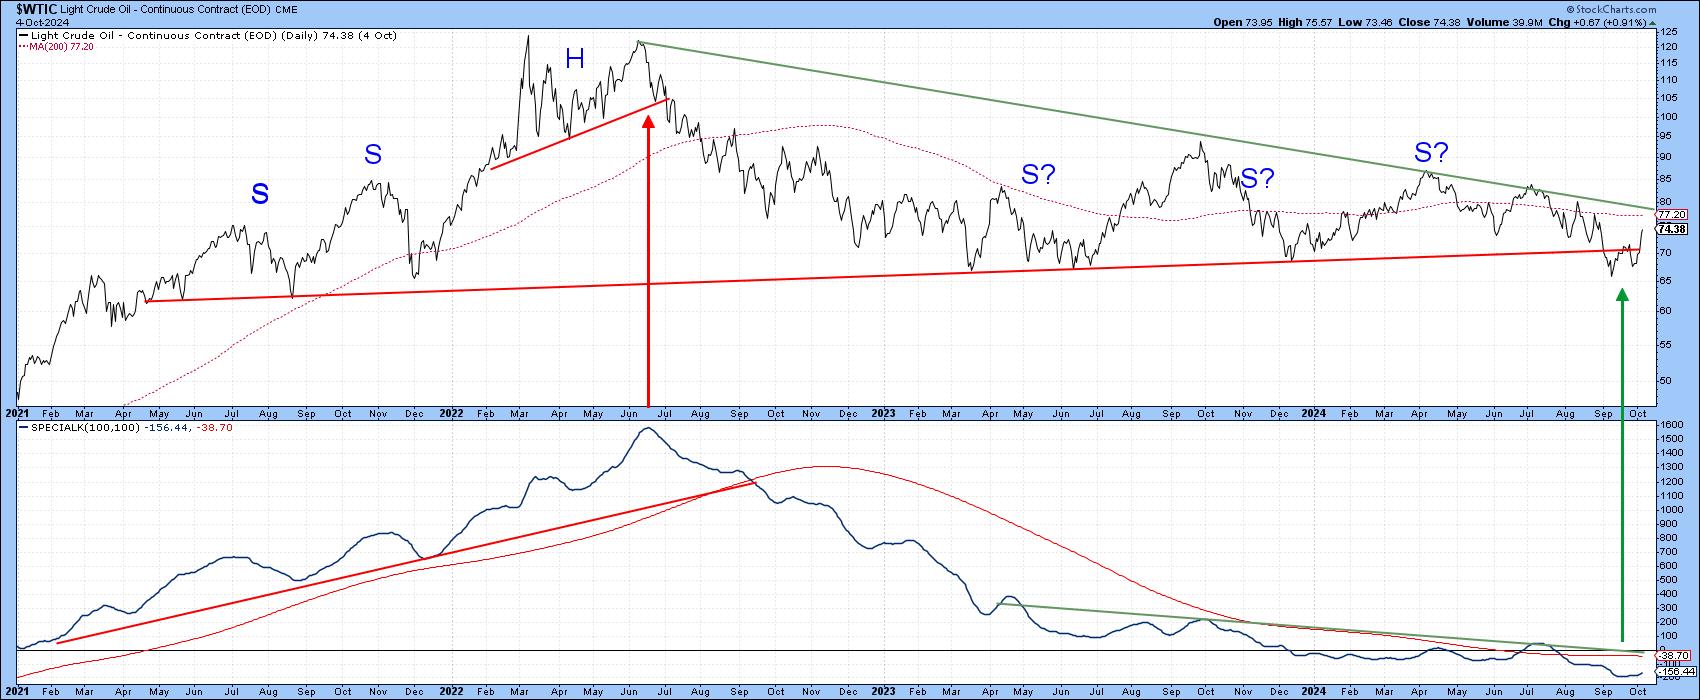
Chart 2 shows the breakdown and pullback in greater detail. The Special K(SPK), which is constructed from the short-, intermediate-, and long-term KSTs, is technically bearish, as it is below its signal line and the green trendline. The red arrow demonstrates the fact that the SPK peaked more or less simultaneously with the price, and the green one demonstrates a potential bottoming of both series. If a cancellation of the breakdown is to take place, it would require some form of confirmation signaling the trend had reversed to the upside, thereby cancelling the breakdown. In this case, a daily close that can hold above the green down trendline and 200-day MA in the $77-80 zone would be sufficient.
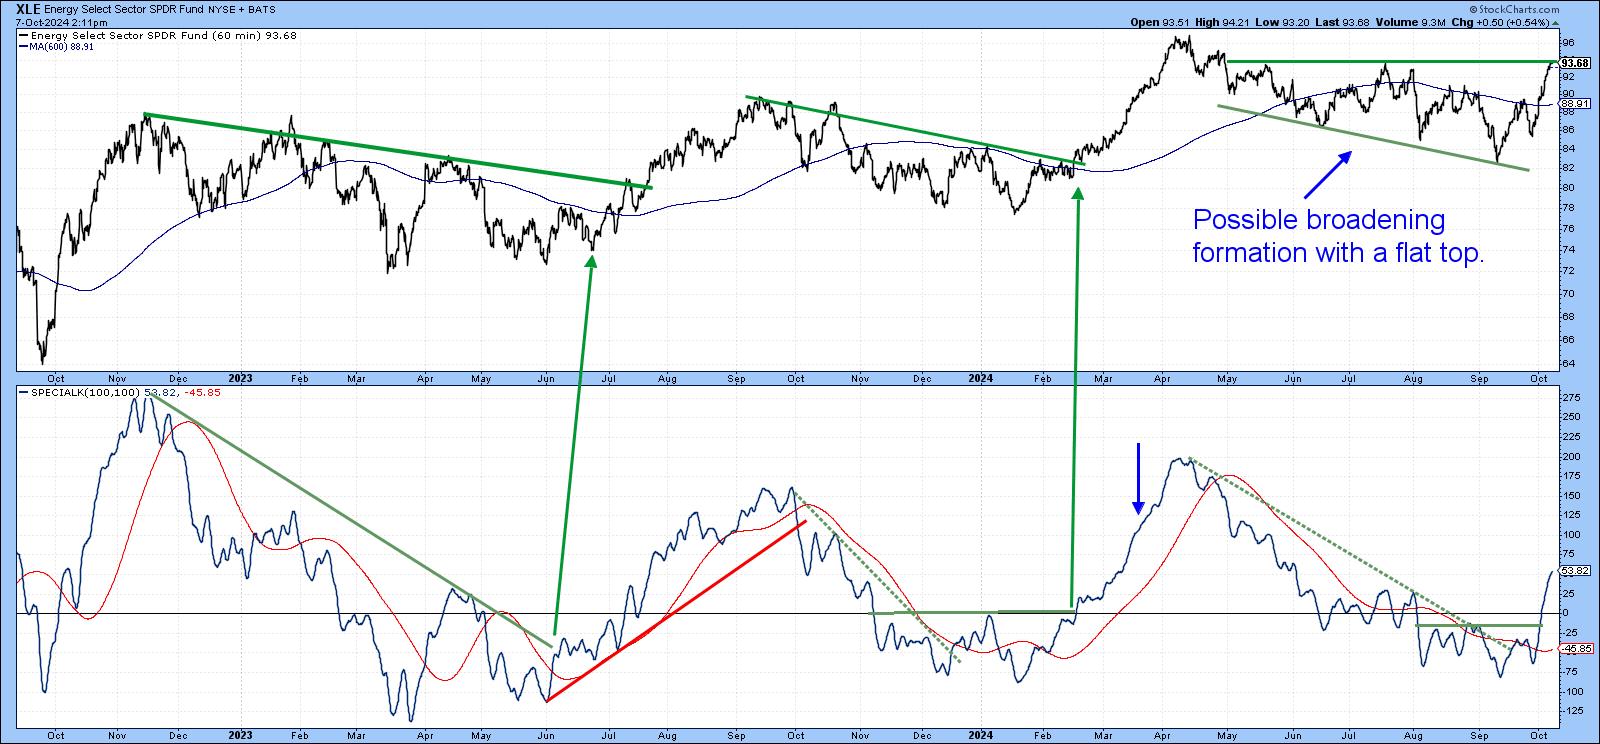
One piece of evidence suggesting this might happen comes from Chart 3, which features an hourly version of the SPK. Whereas the daily Special K monitors primary trend moves, its hourly counterpart has been designed to reflect intermediate moves (6-weeks to 9-months). These are apparent in the chart, which features the SPDR Energy ETF (XLE). A review of the hourly SPK most sectors reveals an established uptrend approximated by the position of the blue arrow. The SPK for the XLE, on the other hand, stands out as an emerging market segment, because it is not overextended and has just completed a base. Particularly encouraging is the fact that the price is close to completing a broadening formation with a flat top. These formations, when completed, resemble inverse head-and-shoulders, where the price is in such a hurry to move higher it fails to form a right shoulder. They are often super bullish.
Commodities Often Move in a Chronological Sequence
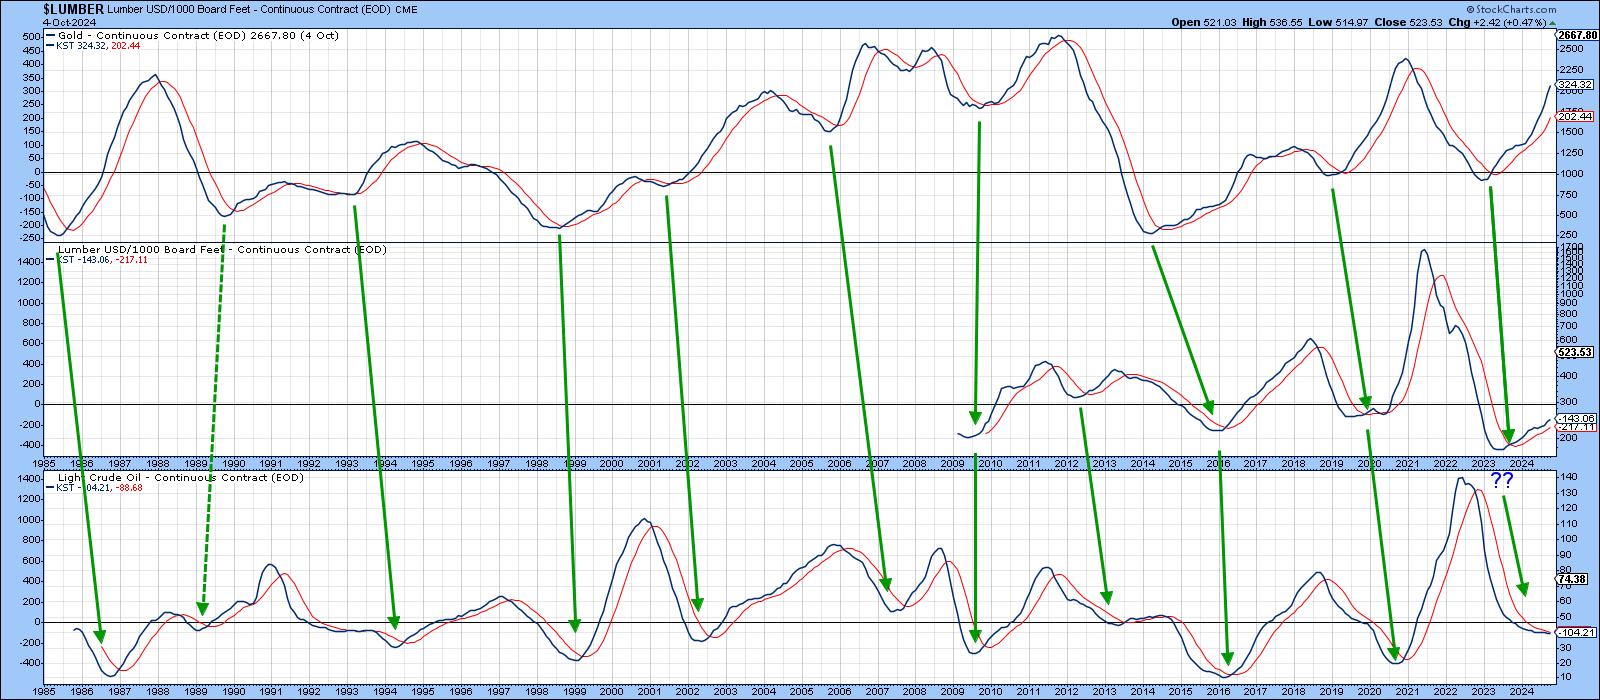
It is not generally known, but some commodities have a set chronological sequence in which they reverse trend. Part of that sequence is featured in Chart 4 in momentum format. Leading the pack is gold, as gold's principal buyers are investors, and investors are primarily interested in trends of future inflation or disinflation/deflation. Those trends start in the commodity markets, in most cases eventually finding their way into the CPI. One commodity with consistent leading tendencies is lumber. The reason is that lumber is tied to the housing industry, which is a leading economic indicator due to its sensitivity to swings in interest rates. The StockCharts database limits us to three previous lumber cycles, but the history of lumber prices can be taken back much further and certainly stands the leading indicator test of time. As is apparent, the lumber KST has already turned up and the model is set up to trigger a momentum buy signal for Crude in the bottom window.
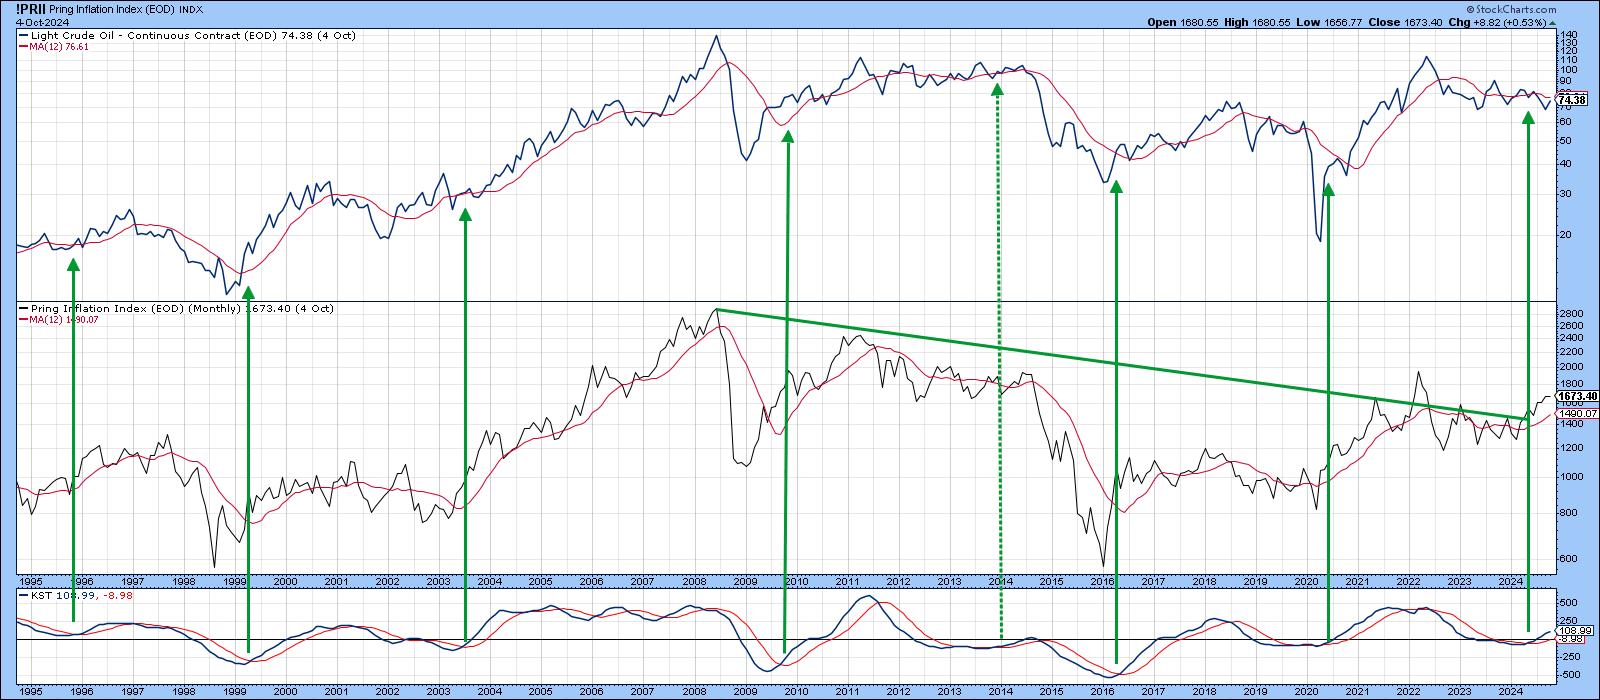
Another way of identifying changes in the long-term trend of crude is to see what the stock market has to say. In that respect, Chart 5 compares crude oil price swings to that of my Inflation Group Index. The Index, which you can read about here, is constructed from four different sectors that are sensitive to swings in commodity prices. It certainly does not follow crude prices tick for tick; however, it does reflect most of the long-term trends, to the extent that buy signals triggered by long-term KST are consistently followed by higher crude prices. These signals have been flagged by the green arrows. In the last 30 years, we have seen seven such signals, but only one, in 2014, turned out to be a whipsaw. A fresh buy signal was generated a couple of months ago, but this has not so far resulted in higher oil prices. That said, the recent violation of the 2008-2024 down trendline in the Inflation Index suggests that inflation-sensitive stocks have much further to run on the upside. If so, the correlation between inflation-sensitive stocks and crude suggests the price of black gold may not be far behind.
Conclusion
The price of crude is in a confirmed bear market, but it would not take much to reverse this status. Based on its relationship with gold and lumber, any sustainable advance is likely to be influenced by business cycle events regardless of developments in the Middle East.
Good luck and good charting,
Martin J. Pring
The views expressed in this article are those of the author and do not necessarily reflect the position or opinion of Pring Turner Capital Groupof Walnut Creek or its affiliates.


